
The price of Solana (SOL) arrives at the end of March with a six month negative streak since October 2025, closing the month with a drop in -0.88% To this we must add the confirmation of a shoulder-head-shoulder (HCH) technical pattern, which opens the possibility of search for support or further falls according to Ananda Banerjee at Beincrypto.
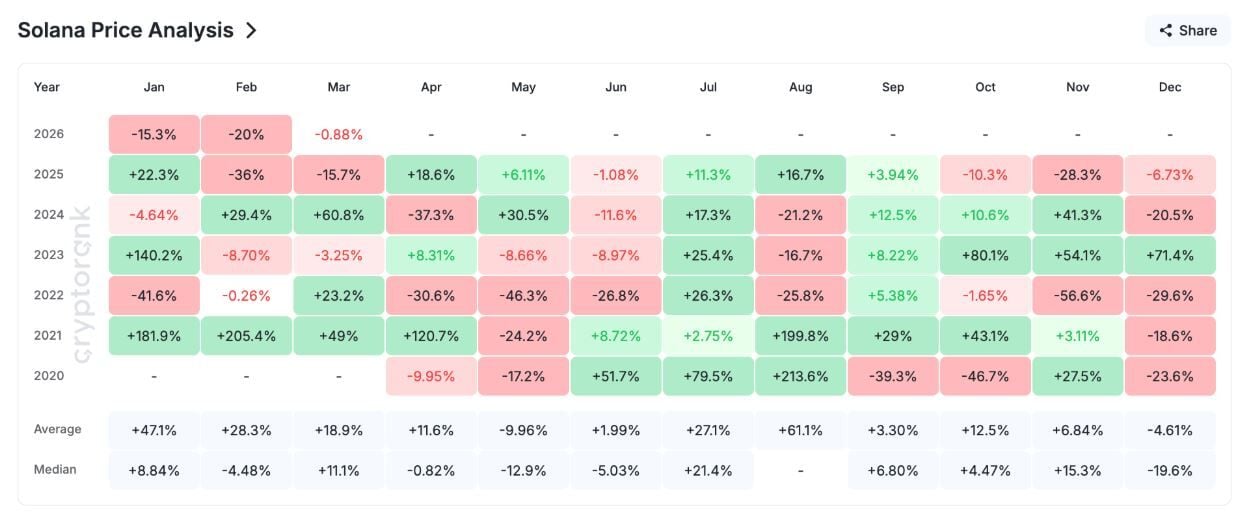
The monthly profitability chart shows that the Solana price has not recorded a single positive month since September 2025. January 2026 closed with a fall of -15.3%,February fell 20%, and March is on track to close in the red with a drop of approximately -0.88%.
This represents six consecutive months of losses, a streak that has defied historical trends. March, for example, records a average profitability of +11.1%, while 2026, so far, shows the opposite trend.
April offers little seasonal stimulus. The SOL’s historical average return in April is located in the -0.82%, making it one of the weakest months on record. Since 2026 has already broken several downward seasonal patterns, relying solely on historical averages would be risky.
The daily chart reinforces the bearish outlook for April. A shoulder-head-shoulder pattern She completed her breakup on March 27.
The head-to-neck line movement since the breakout projects a target close to the 73 dollarswhich would represent an additional drop in the 15%.
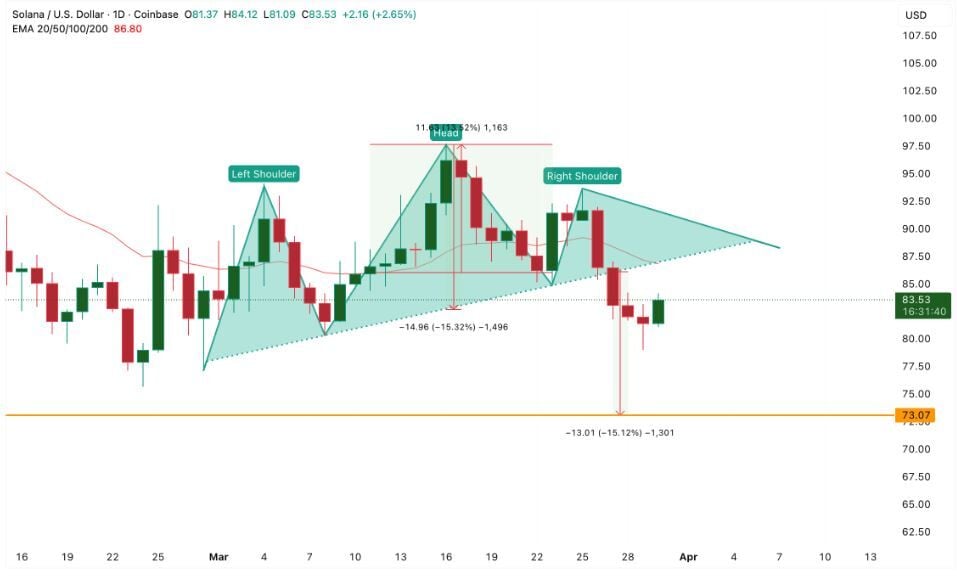
The 20-day exponential moving average (EMA)a trend indicator that gives greater weight to recent price movements, is currently at 86 dollars ($86.80 to be exact) and could be SOL’s only hope of recovery.
The last time SOL recovered this level, early marchtriggered the rebound in 13% that formed the pattern head. Looking ahead to April, SOL’s ability to reclaim the 20-day EMA or continue below it will set the tone for the month.
But it is also necessary to analyze the metrics on the blockchain.
Demand on exchanges decreases as SOL decline consolidates
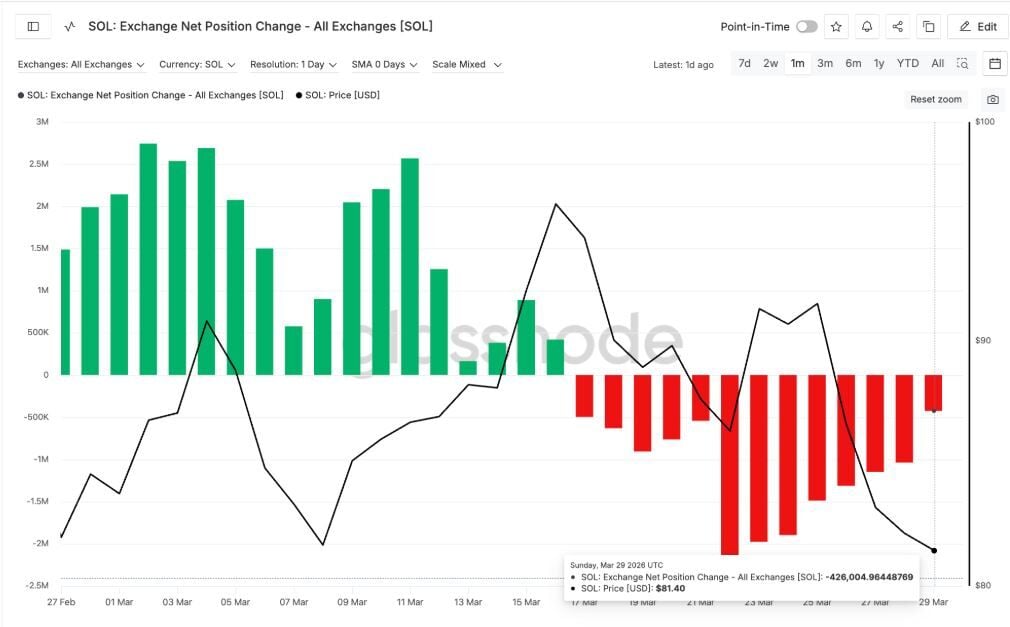
Data on the blockchain shows that the buying pressure that fueled SOL until mid-March has faded as April begins. He change in net position of exchangesa measure of token flow on and off platforms, showed strong accumulation between March 17 and March 22, peaking at around -2.180.253 SOL. This negative reading indicated that cryptocurrencies were leaving exchanges, a classic sign of spot purchases.
However, since the head-shoulder pattern broke on March 27, this indicator has plummeted to approximately -426.004 SOL to March 29. This represents a drop in 80% in buying pressure in just one week.
The net unrealized gain/loss (NUPL) of short-term holdersan indicator of the aggregate profitability of holders (short-term only), adds an additional level of risk heading into April.
The NUPL de STH has increased dramatically since a deep capitulation of -0.95 on February 5 to -0.27 on March 25. It is currently located around -0.40. While still negative, short-term holders are now posting much smaller losses than a few weeks ago.
This creates a problem. If spot demand does not recover during April, these holders could choose to sell at a smaller loss rather than continue to ride out the decline. A new wave of sales by this group could accelerate the movement towards the goal of 73 dollars.
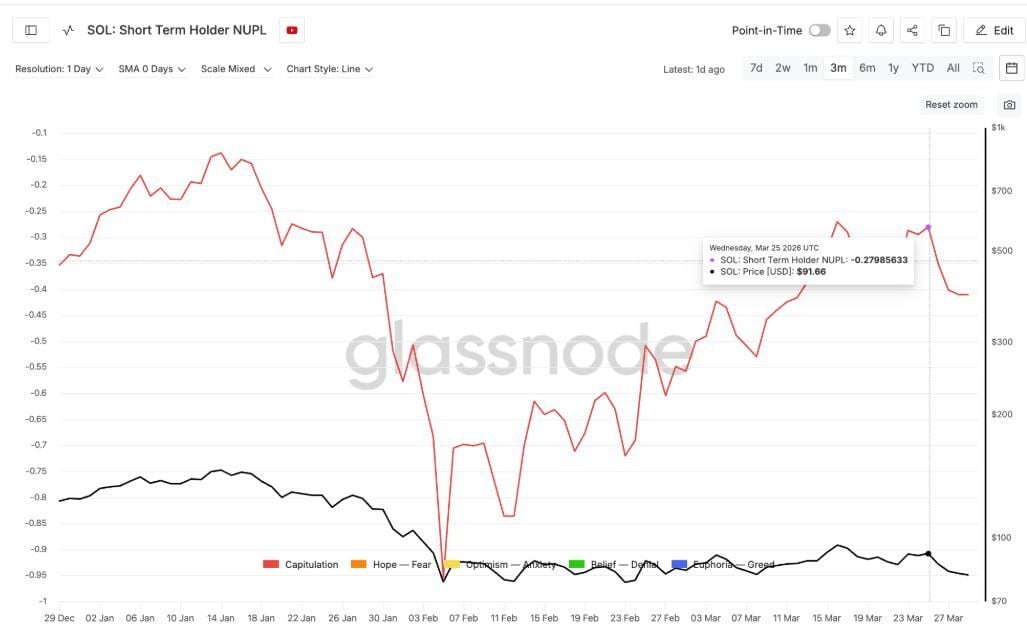
The combination of falling demand on exchanges and improving losses for short-term investors at the beginning of April weakens the demand outlook, even as the technical structure already points to a bearish trend.
Long-term investors offer resistance, but history limits confidence
The only indicator that contradicts the bearish scenario is the accumulation of positions by long-term investors. The net change value of long-term investors’ position increased from 523,624 SOL on March 8 to 2,327,302 SOL on March 29an increase of more than fourfold. These are medium to long-term participants that are aggressively acquiring positions and could provide a psychological support for short-term investors considering selling.
However, long-term investors’ conviction comes with a caveat. When this group began to accumulate positions significantly among the January 10 and 31the price of the SOL fell from $135 to around $105 during that period.
Its buying pattern has not historically aligned with price recoveries, limiting the bullish confidence this indicator can offer heading into April.
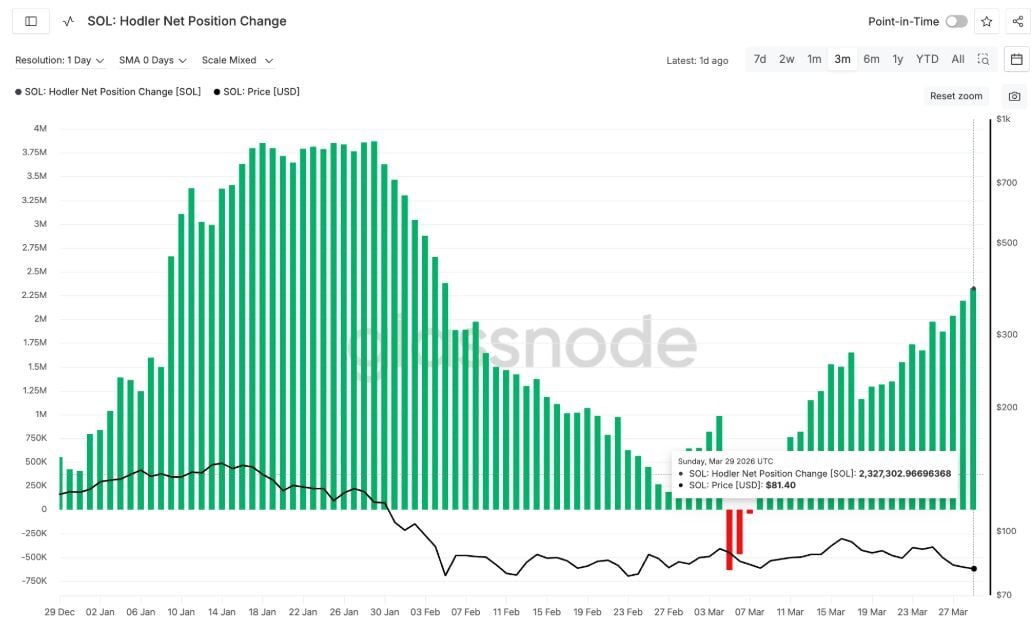
If capital outflows from exchanges resume and spot demand returns at the beginning of the month, hodler accumulation could underpin a recovery. Without that confirmation, your purchases alone might not be enough to prevent a gradual move from occurring.
Solana price levels to watch in April
The most critical price level for Solana at the beginning of April is 80 dollars. This level coincides with a short term support. A daily candle close below $80 would make the target 73 dollars was much more realistic, opening the door to a fall in 15% from the breaking point.
The $73 level also coincides with the 61.8% Fibonacci retracement zone, which adds confluence to that target area.
On the upside, the first level that SOL must recover to gain strength is 85 dollarsthe Fibonacci level of 61.8-5. Above this level, the 20 day EMA at $86 becomes the key line.
A clean recovery above $86 could fuel near-term bullish momentum and test the right shoulder high near $93. A sustained move above $93 would significantly weaken the entire bearish structure.
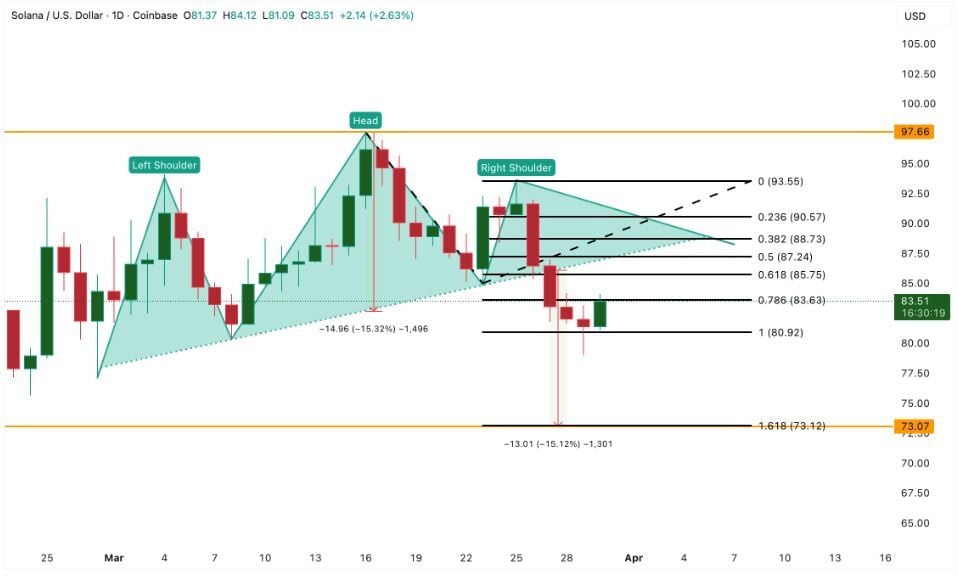
For now, facing April, the key is to stay above $80. The decline in demand on the stock exchanges, the improving, although still fragile, position of short-term holders and the confirmation of the breakout of the head and shoulders pattern suggest that the most likely trend remains downwards.
A sustained stay above $86 separates a relief rally towards $93 from a continuation towards the breakout target of $73.
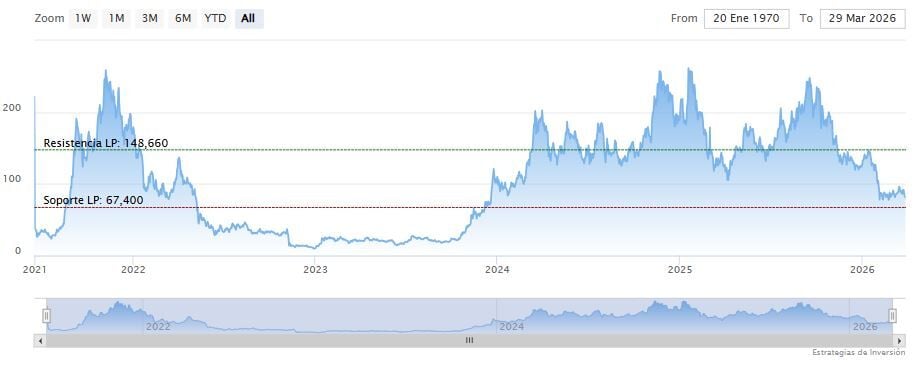
Solana opens Tuesday higher at $82.47. The 70-period moving average remains above the latest candles, RSI is up at 41 points and the MACD lines are below the zero level.
Medium-term support is at $67.40. Meanwhile, Ei indicators are mostly bearish.