

The price of Litecoin (LTC) He has shown a correction of its value in the last 24 hours. But this is accompanied by a Whiter signal that have marked us Bollinger bandswhich could lead to a Persistence of the bassist feeling according to Godfrey Benjamin en U Today.
Litecoin’s technical indicators become bassists
It should be noted that the 20 -day mobile average of Bollinger’s bands De Litecoin reveals that the price points down after breaking the support formed by the middle band. This indicates that the general feeling in the Litecoin ecosystem is still bassist.
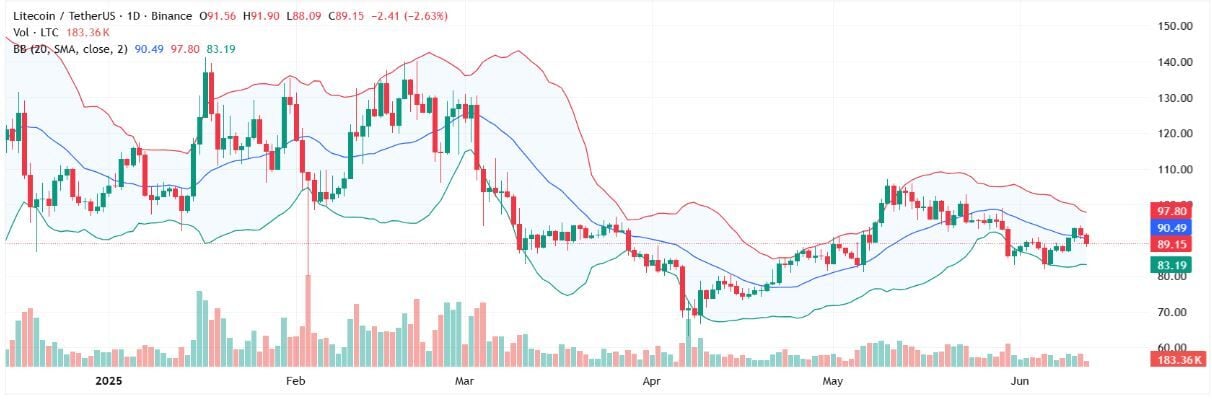
If this trend continues and nothing forces it to change course, the currency could continue in this bearish trajectory, which could trigger another LTC drop soon.
According to data from CoinmarketcapLitecoin Cotiza 89.26 dollarswhich represents a 3.59% drop in the last 24 hours. Investors have also retired due to the price drop, since the volume of operations a one has fallen 3.51% to the 425.29 million dollars In the same period.
Litecoin reached a maximum of 94.01 dollars before market volatility collapsed it to a minimum of 88.24 dollars. However, the support level of 88 dollars It remained while bouncing until the current price.
Meanwhile, according to the Bollinger band indicator, LTC could collapse until 83.19 dollars If the trend persists, unless Litecoin’s bulls force resistance.
Could the Litecoin history boost a rebound?
Litecoin is showing bearish signals, which marks a change regarding the price gain of 12% that experienced one May. It should be noted that LTC shot more than $ 90 despite Delays of the US stock and securities commission. UU.
This development highlights the volatility of the digital asset market and how fluctuations could affect the trajectory of its price.
Despite the bearish feeling, Litecoin market participants anticipate a rebound based on Historical trends. Litecoin had an average growth rate of 8.86% in June, and if history is repeated, the currency could reach the 97.17 dollars.
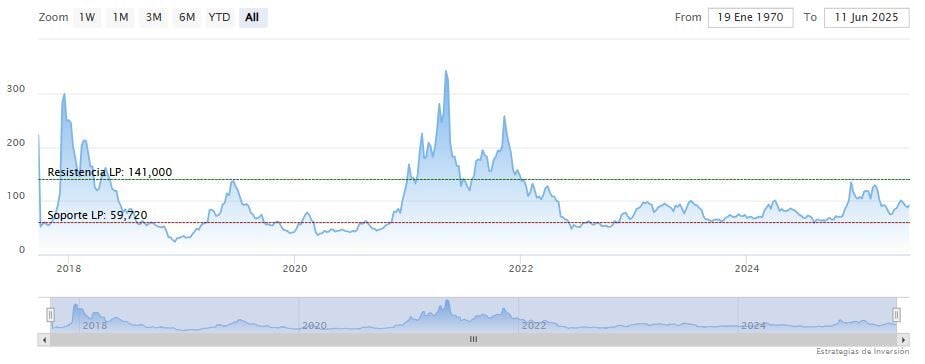
Litecoin Open Friday session downward at 86.49 dollars. The moving average of 70 periods is on the last candle, RSI downward in the 43 points and the MACD lines below the zero level.
Medium -term resistance is found at $ 112.50. Meanwhile, IE indicators are mixed.
Free Bulletin.
Register for free in our cryptocurrency and digital assets bulletin.