
Bitcoin whales (BTC), investors with more than 1,000 accumulated currencies, have decreased their sales pace in the last 30 days.
In the following graph you can see what has been The behavior of whales so far this year and their relationship with the price of Bitcoin (black line).
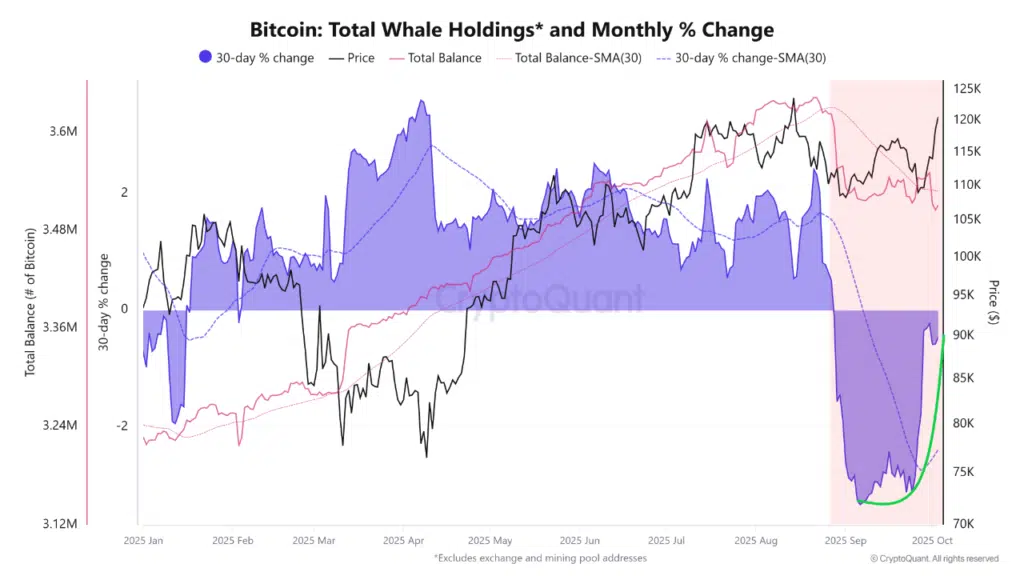
The pink line shows the total amount of BTC that whales possess, while the dotted pink line represents the 30 -day mobile average of these holdings. For its part, the blue shaded area reflects the monthly percentage change of its holdings, with its 30 -day mobile average indicated by the dotted blue line.
When the blue area is above 0, Whales increase their BTC; When they are below, they reduce them.
In the graph provided by Cryptoquant there is a green line that suggests that whales are braking their sales, which favors the price of the currency created by Satoshi Nakamoto.
This is because by reducing the available supply, even without active purchases, the demand for other participants has greater impact, promoting the value of the asset.
The decrease in sales pressure coincides with the BTC price rebound, which On October 5 it reached a historical maximum (ATH) of $ 125,000as Cryptonoticia reported.
In this regard, the cryptocant analyst, Burak Kemesci, believes: “The whales have been net seller for almost a month, but in early October, this pressure has clearly decreased. This could indicate a possible phase of reactumulation. stable ”.