

From the lows of Friday, November 21, the Mini S&P 500 Future managed to recover more than 5.4% to the highs reached today, a recovery that allows the recent activation of new upward cuts by the daily MACD momentum oscillator.
Said tertiary rebound, classified as tertiary or very short-term, despite its intensity, continues to trade below the key resistance in both the short and medium term, ceiling or resistance that we identify from the highs of the second shoulder of the distribution figure or active bearish implications in the form of Shoulder-Head-Shoulder (HCH). Specifically, we are referring to the 6,900 points that are projected from the highs of November 12.
Mini S&P 500 Future (SP500) on daily scale with volatility (upper center chart), MACD (lower center chart) and trading activity (lower window). Source: ProRealTime and own elaboration.
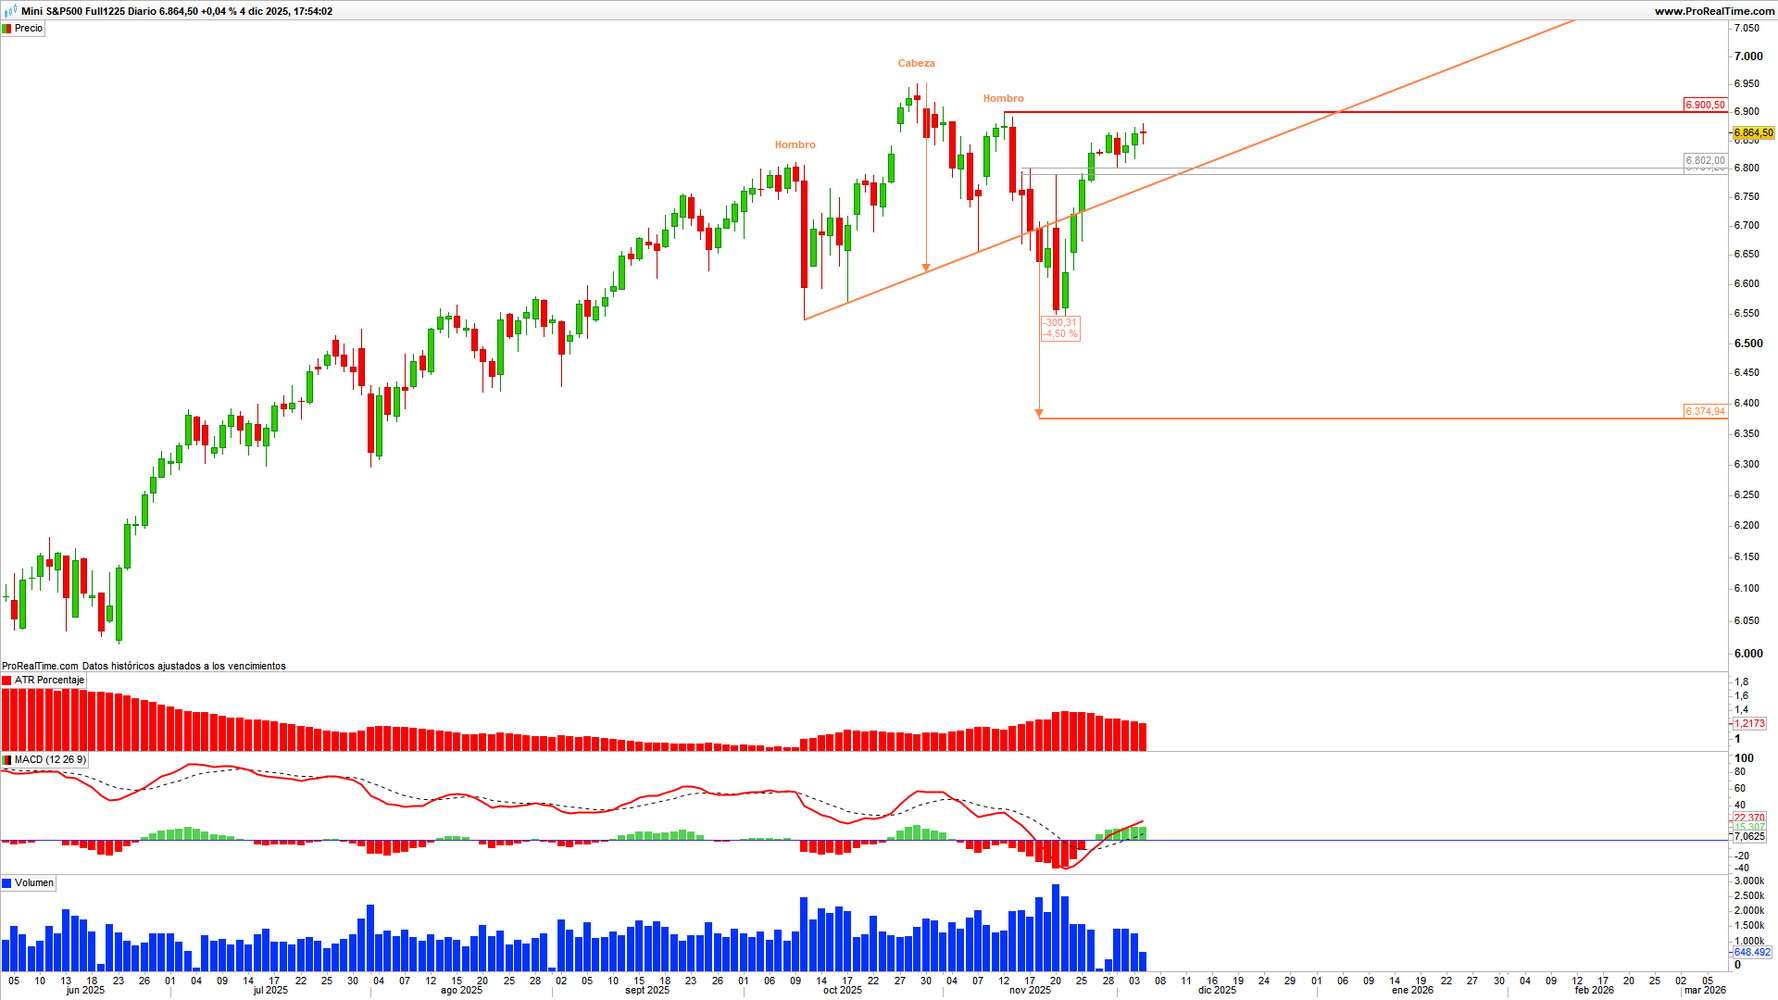
In this sense, the development of the exposed bullish rebound allows the construction of an area of technical relevance, that is, an area of the price that has functioned as a previous resistance and now as a potential support, perfectly identified from 6,802 / 6,791 points, an area that must be kept intact at the close of the daily candle to keep the attack at 6,900 points alive. Otherwise, that is, if it registers a daily close below 6,791 points, the Mini S&P 500 Future would begin to show symptoms of inability on the part of purchases and, therefore, the price would continue building successively lower highs, which could increase the probability of rotating downwards to the minimum objective derived from the Shoulder-Head-Shoulder located at approximately 6,374 points.
Access the S&P 500 trend force indicators