
The selling pressure of altcoins – cryptoassets excluding bitcoin (BTC) – reached its highest level in 5 years, since there are records in this regard. This is shown by CryptoQuant on-chain data shared on February 18, 2026.
Since 2020, the accumulated purchase/sale differential of altcoins in one year, except for ether (ETH), the Ethereum cryptocurrency, decreased by 209 billion dollars (USD). This reflects the magnitude of capital that has come out of these assets.
January 2025 was the last time this metric hit near zero, which meant demand was close to equaling supply. However, since then, selling pressure has been increasing, as seen in the chart below.
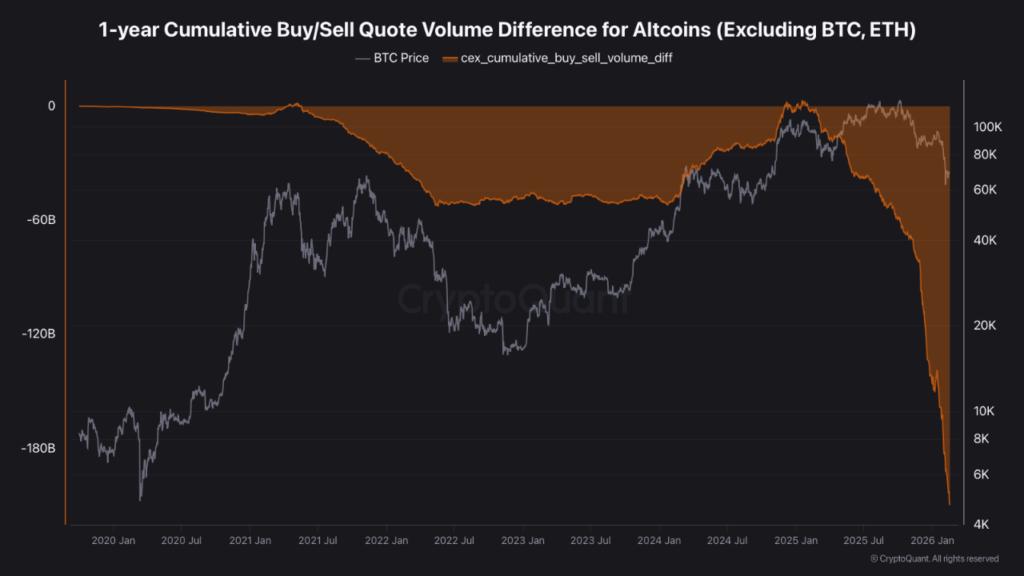
«This is not just another fall. «There are 13 months of continuous net cash sales on centralized exchanges,» commented the analyst known as IT Tech. «The outflow of $209 billion does not mean a market bottom. It means the buyers are gone. Retail is out. The smart money has rotated. “No institutional accumulation of altcoins is seen.”
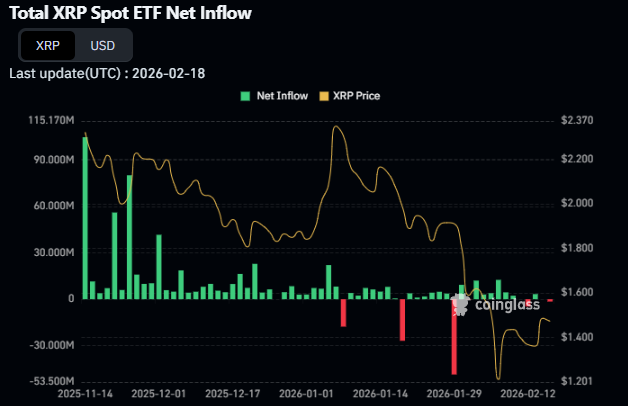
However, it should be noted that Some institutional investment in altcoins is being seen outside the spot marketfrom exchange-traded funds (ETF). For example, XRP instruments of this type, launched in the United States in November 2025, have since seen mostly days of capital inflows.
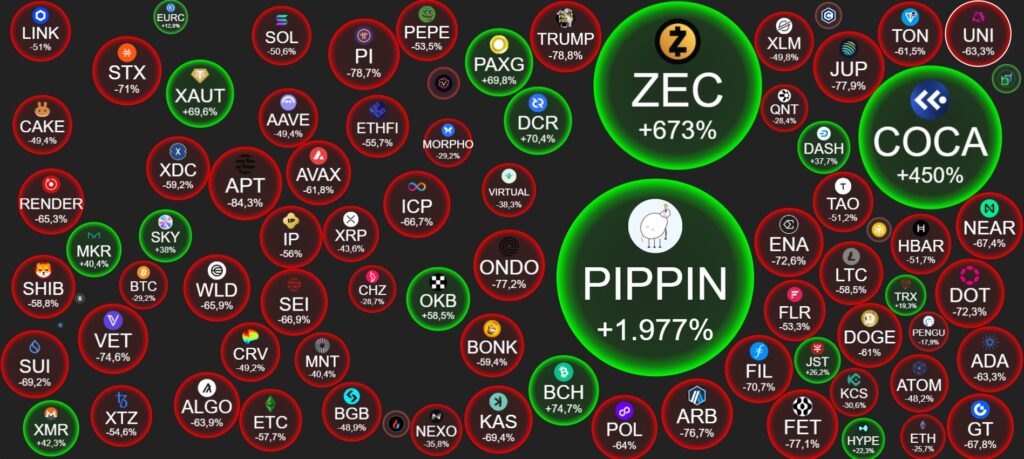
Even so, the marked underperformance of altcoins against bitcoin reflects its greater sales pressure. Especially since the latter fell from its all-time high of $126,000 in October 2025.
At the time of this writing, as can be seen in the NoticiasVE Calculator, bitcoin is trading at $66,700. This is 47% less than its all-time high and a drop of 29% in one year.
On the other hand, altcoins in general record greater losses, as the following image illustrates.
Bitcoin gains dominance despite sales
“During deep corrections or late phases of bear markets, investors tend to rotate capital into bitcoin while away from altcoins,” says the analyst known as Darkfost. This behavior can be observed by analyzing trading volumes on Binance, the cryptocurrency exchange with the highest trading volume.
As bitcoin recovered from $60,000 three weeks ago, on February 6, there was a notable shift in the distribution of trading volume. The next day, bitcoin trading volumes on Binance regained dominance. Since then, they represent 36.8% of the exchange’s total volume. In comparison, altcoins (excluding ETH) account for 35.3% and the Ethereum cryptocurrency accounts for 27.8%.
Furthermore, altcoin trading volumes have been the hardest hit during this correction. Compared to November, when these represented 59.2% of Binance volumes, their share currently stands at around 33.6%. That represents a nearly 50% contraction in altcoin activity.
This pattern has manifested itself during previous corrective phasesincluding April 2025, August 2024, and October 2022, near the end of the bear market. This can be seen in the following graph.
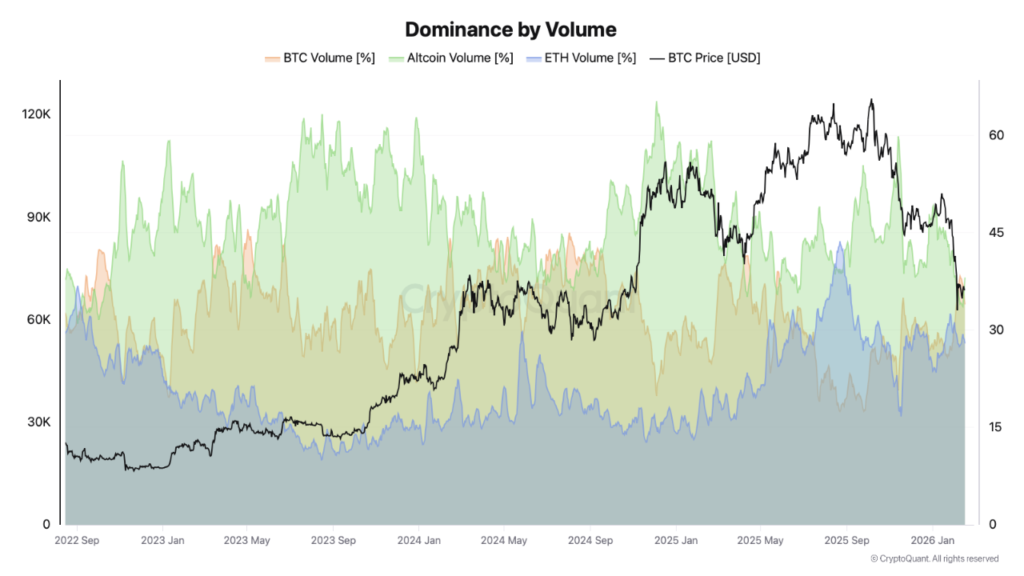
“It is especially striking to see how bitcoin’s share of trading volume increases during periods of market uncertainty and stress,” says Darkforst. “In these environments, investors naturally gravitate toward BTC, reinforcing its role as a primary capital preservation asset and highlighting its continued status as the market’s central bellwether.”
In line with this pattern, Google searches for the word “altseason” They decreased from 100 points, the maximum level of interest, in August to 2 points at the moment. This term refers to a season in which altcoins have a higher performance than bitcoin.

An altseason usually occurs after a sustained bullish trend in bitcoin, since it causes enthusiasm and demand to expand to the cryptocurrency market, which triggers its prices due to its lower capitalization.
The drop in searches for this word shows the lack of interest in such an event in the short term, which may be encouraging selling pressure. This occurs while, as NoticiasVE reported, it is estimated that a crypto winter could deepen this year.