
The market officially starts in the new year and the S&P 500 is shown particularly expensive at the beginning with artificial intelligence or AI as the flag of a powerful upward trend. Even the CAPE cyclically adjusted price-earnings ratio or Shiller price-earnings ratio (P/E) is shown historically highwhich leads one to think what will be the address of the index in the next 365 days, according to Steven Porrello at Yahoo Finance.
Over the past decade, the S&P 500 has had a magnificent run. To the December 30the S&P 500 has gained approximately 230% in the last 10 yearswhich is equivalent to a compound annual growth rate (CAGR) from around the 12.6%.
This is not only higher than its long-term CAGR of approximately 10% over the past 97 years, but it is also the kind of above-trend decade that can turn an initial sum of $100,000 into a nest egg of more than $330,000.
The S&P 500 has had its ups and downs over the last 10 years. But a red flag hidden in its overall rise could be sending a warning: The current market looks expensive, even when accounting for good and bad years.
I am referring, of course, to the cyclically adjusted price-earnings ratio (CAPE ratio), or Shiller price-earnings ratio (P/E). This market heuristic is designed to smooth out volatility, such as recessions and short-term earnings peaks, averaging earnings-adjusted earnings inflation of the previous 10 years. It gives investors a clearer idea of whether the market is truly expensive or distorted by an economic cycle.
Simply put, the S&P 500 is trading at a historically high CAPE ratio. How historic? Try this: It just happened once before 2025 since data was recorded in 1871. By historical standards, the CAPE of the S&P 500 is in territory traversed by the dotcom bubble.
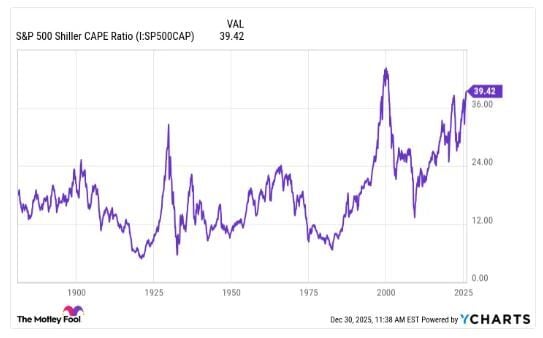
The current CAPE ratio has recently hovered between 39 y 40 (and closed 2025 slightly above 40). This is only the second time in market history that this valuation indicator has exceeded 40. When the Shiller P/E approaches this level, it is usually followed by a strong reversalas seen in the previous graph, although the moment of said reversal has varied considerably.
Could the market crash in 2026?
Of course, a record Shiller P/E doesn’t mean 2026 is the next dot-com bust (or another Great Depression), and comparing Shiller’s P/E across decades isn’t exactly equivalent. The current large cap companiesespecially those that dominate the technology landscape, differ significantly from the companies that populated previous versions of the index. The artificial intelligence (AI) It remains a powerful secular trend, and the infrastructure needed to develop it (energy, industry and materials) could sustain high growth in 2026 and beyond.
At the same time, it would be reckless to completely ignore the valuation. The stock market is historically expensive, and perpetual growth expectations could induce investors to overpay for shares that are based on little more than promises and hype.
Now more than ever, caution and reflection They are crucial. Investors who have already been in this situation, even as recently as the «bubble of everything» of 2021they know how important it is to choose companies with durability that goes beyond short-term exuberance.
In short, I do not predict a crisis like that of 1929 in 2026 and I cannot say with certainty that the market will continue to grow from now on. Next year, you’d hold onto your high-quality stocks regardless of market direction, and measure each investment decision with discipline, rather than emotion.