
-
Bitcoin’s current fall is not unusual, even in bullish cycles.
-
In the medium and long term, the upward expectation of BTC is maintained.
The recent Bitcoin (BTC) fall, which accumulates 12% since its last historical maximum of USD 124,000, has generated a clear restlessness in the market. But, for the calm and tranquility of investors, certain data suggests that the movement is completely normal during bullish cycles.
In the current Bitcoin cycle, started with the maximum of March 2024, the largest fall reached 28% and, on average, The most severe corrections have been located between 20% and 25%. Therefore, the current magnitude does not break the historical behavior.
According to the Cryptoquant community analyst known as «Darkfos», these phases usually have a functional effect on upward markets. This explained it:
«This current movement is not unusual and could continue without breaking the historical pattern. In fact, these setbacks are usually healthy in the upward markets, since they serve to restore excessive leverage in derivatives, cool overheat feeling and provide new entry opportunities for long -term investors ».
Darkfos, financial analyst.
In the following graph shared by Darkfos it is appreciated that the most marked setbacks of BTC during the current cycle average 20%.

Other voices coincide
The interpretation of Darkfos coincides with that of Carmelo Alemán, also an analyst of the Cryptoquant community, who considers that recent decreases in the price of BTC should be read as an adjustment within the same cycle.
Remember that, despite the recoil, the on-chain data «continues to show signs of accumulation by the long-term holders, while BTC reserves in Exchanges continue to fall.» He explains that this suggests a «moderate sales pressure» in the market.
German indicated that Bitcoin’s upward cycles have historically been accompanied by significant corrections before reaching new maximums.
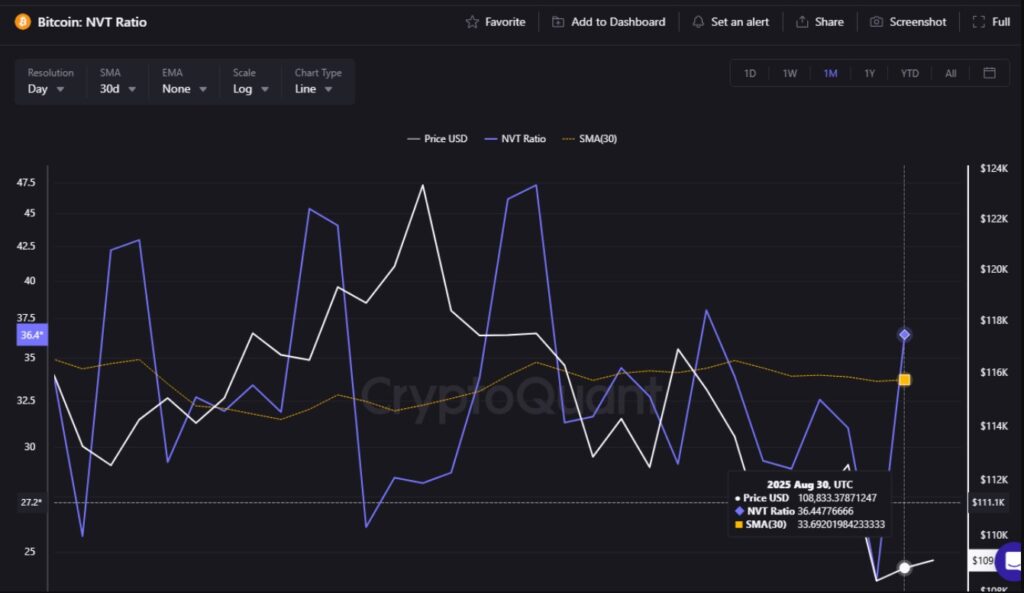
Among the indicators analyzed, the NVT stands out, a metric that compares market capitalization with the volume of network transactions. When the NVT remains low, it implies that Bitcoin can be undervalued in relation to real activity. In that sense, since July 7 the indicator is below 50, a level historically linked to growth signals. In this graph you can see better:
The analyst also reviewed the MVRV, which measures the relationship between the market value and the value performed. In spite of the previous increases in the price, this index is not yet close to the critical levels of 3.6, which in previous cycles coincided with historical peaks and maximums, which indicates that a phase of euphoria has not been reached.
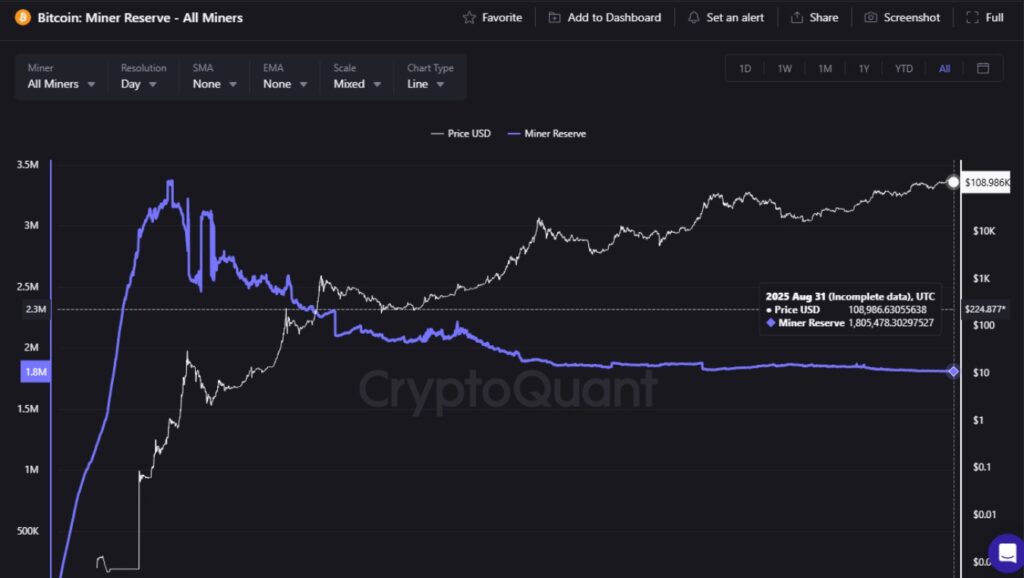
This behavior of miners is also observed as a relevant variable. German explained that the reserves of the Bitcoin miners remain stable at 1.8 million BTC, with a reduction of just 6,000 bitcoin so far from 2025. In previous cycles, the miners used to sell more aggressively in times of maximum, but the absence of that trend reinforces the idea that there is space for a new upward stretch.
In this graph the behavior that Bitcoin miners have had over the years:
Another reference is the Asopr, metric that measures the profitability of the coins moved in the network. When this ratio is maintained above 1.00 for prolonged periods, it indicates that most movements generate profits, which in sustained phases has coincided with market peaks.
Alemán stressed that, although the indicator remains positive, at 1.00 levels, it has not reached levels that define an overvaluation stage. Together, these metrics show that Bitcoin crosses a correction, but with a context still favorable for an eventual rebound if the demand is sustained.
Divergent visions
In addition to these readings, other analysts maintain positive expectations about BTC. Oriental Trader, digital market specialist, argues that there are foundations for optimism. Among them mentions the growing liquidity in global markets, the expectation that the United States Federal Reserve can apply cuts in interest rates and Bitcoin’s ability to offer returns superior to those of traditional assets. According to their vision, these factors hold an environment that could reinforce the accumulation narrative and maintain the interest of institutional and retail investors.
However, not all readings are convergent. The Glassnode analysis firm considers that The Bitcoin market maintains a relevant fragility level. In their most recent report, they stressed that «the market structure is still fragile, with bearish pressures that dominate the metrics in cash, of futures and on-chain.» They also pointed out that entrances to the Bitcoin ETF negotiated in the United States functioned as a temporary mattress, but the contraction of volumes and the weakening of profitability show a lack of conviction.
According to this analysis, the possibility of short -term rebounds exists, Although the general feeling remains defensive, with tilted risks towards greater consolidation If a stronger demand does not emerge.
The divergence of positions reflects the current state of the market, where the signals of bullish continuity with warnings on structural vulnerabilities live together. For defenders of the accumulation thesis, on-chain metric and macroeconomic foundations provide support to the argument that BTC has not yet reached a roof in this cycle. The most cautious, on the other hand, emphasize the reduction in the impulse of purchase and the signs of weakness in activity indicators.
It is more than clear that Bitcoin crosses a correction that, according to the historical registry and the metrics of the network, is maintained within the parameters of a bullish cycle. Therefore, the evolution of the demand indicators, the activity of the miners and the flow to instruments such as ETF will be key pieces that help determine if the behavior of BTC is a prelude to a new advance or at the beginning of a prolonged stage of consolidation.