
José Antonio González, market analyst at Investment Strategies, points out that, despite this weekly rebound, the reality is that we continue to develop decreasing highs and lows compared to the previous weekly candle.
This behavior also occurs along with an increase in volatility levels and a worsening in the technical moment reflected by the MACD. Consequently, the corrective environment that has been developing since the annual highs – reached at the level of 18,573 points— remains valid for another week.
Therefore, it highlights that We continue to monitor the ceiling or resistance levels that we already mentioned last week. On the one hand, it is a necessary condition to overcome, at the close of the weekly candle, the bearish guideline that starts from those annual highs. On the other hand, as a sufficient condition to consider that the worst in the short term has passed, we would require a weekly close above the last rising maximum recently recorded at the level of 17,500 points.
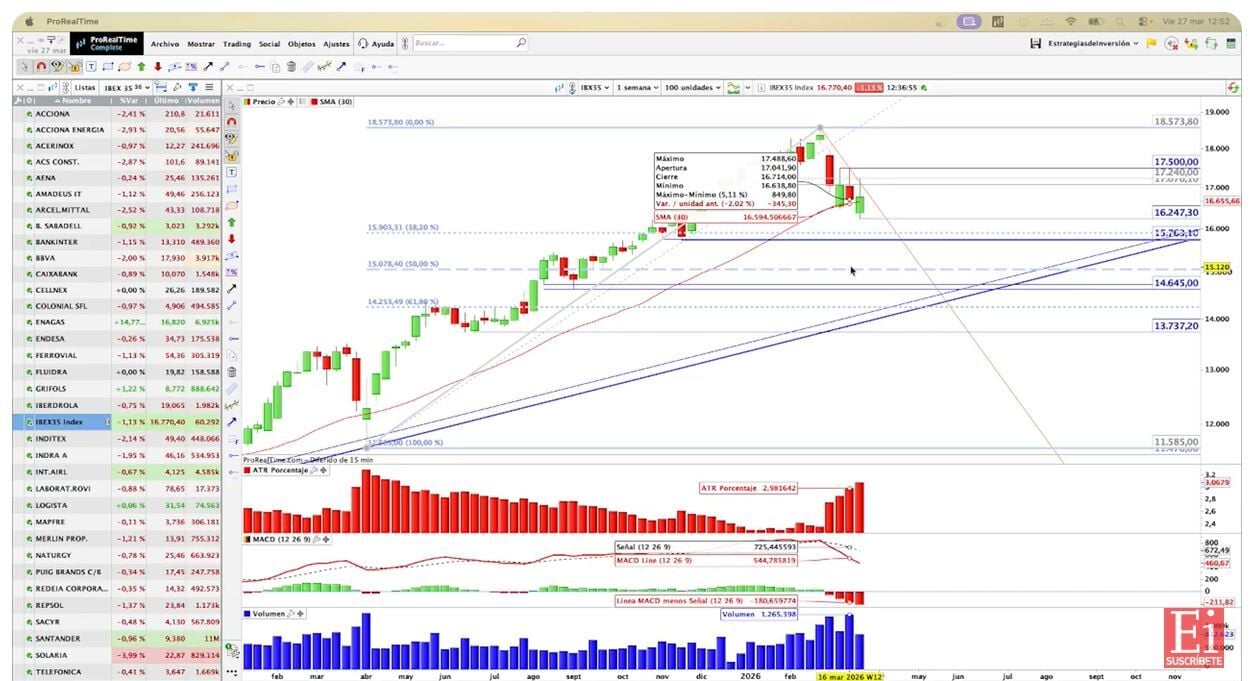
Stay, therefore, with that key reference: the 17,500 points. As long as we do not see weekly closings above that level, we understand that short-term risks continue to favor falls, which keeps the viability of the lows reached this week at 16,247 points under threat.
In fact, weekly closures below this level would be a scenario to prioritize in the very short term. In that case, the next movement would be the update of bearish objectives, aimed at the most relevant support that we highlight: on the one hand, the Fibonacci retracement of 38.2%, located at 15,900 points; and on the other, additional support projected around 15,763–15,724 points.
Access the complete analysis of all Ibex 35 companies with their key support and resistance levels