
The Solana network reached two historical activity milestones in the same week, recording record levels in both the daily transaction volume and the weekly average of processed operations.
January 30 was the busiest day ever recorded in Solana, with 148 million non-voting transactions processed in just 24 hours. This data marks a historical maximum for the network and confirms a significant jump in its level of use.
So-called non-voting transactions exclude internal operations that validators use to coordinate the operation of the network. For this reason, they are considered a metric more representative of actual use by users and applications.
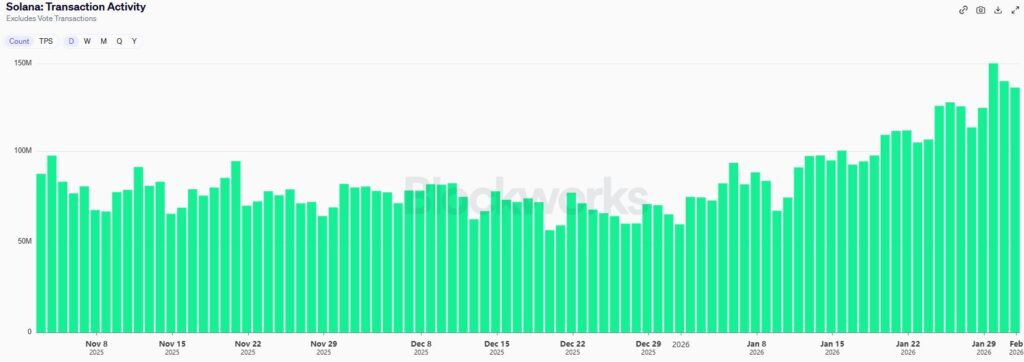
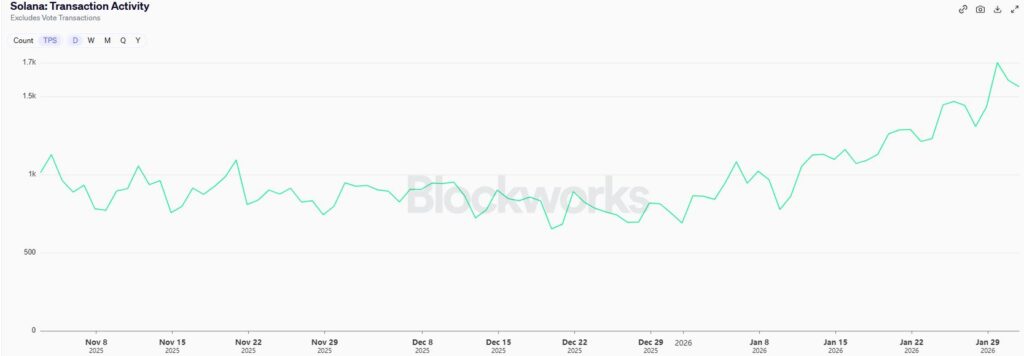
This is a daily record that was not an isolated event. It occurred within the most active week in the entire history of Solana. A period in which the network processed almost 1,000,000 transactions and reached an average of 1,505 non-voting transactions per second (TPS).
The data reflects a sustained acceleration of activity towards the end of January, with weekly maximums that consolidate to that period as the one with the greatest operational load. This, since the launch of the network in 2020.
Beyond raw trade count, a significant portion of network usage is concentrated in decentralized finance (DeFi) applications that maintain high levels of total value locked (TVL).
According to data from DefiLlama, capital in Solana is mainly distributed between decentralized exchange protocols, loans and liquidity provision.
Among the applications with the highest TVL Jupiter, Raydium, Marinade, Orca and Solend stand out on the network. These protocols concentrate a good part of the capital and explain why the increase in transactions does not respond only to specific movements, but to sustained financial use.
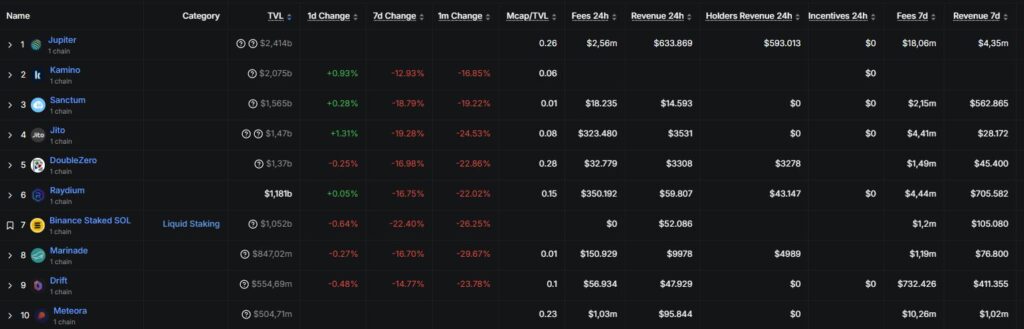
This data is relevant because the TVL measures how much capital remains deposited in the protocols and allows us to differentiate between peaks of speculative activity and more stable participation. In the case of Solana, the ranking of the main applications shows that, despite the volatility of the market, Capital continues to be concentrated in a small group of platforms.
On the other hand, the behavior of stablecoins in Solana provides an additional signal. Although the total volume of stablecoins has fallen in recent months, the level of TVL associated with these assets remains high ($13,777 million). This fact indicates that part of the capital did not leave the network, but rather reduced exposure or rotated positions within the same environment.
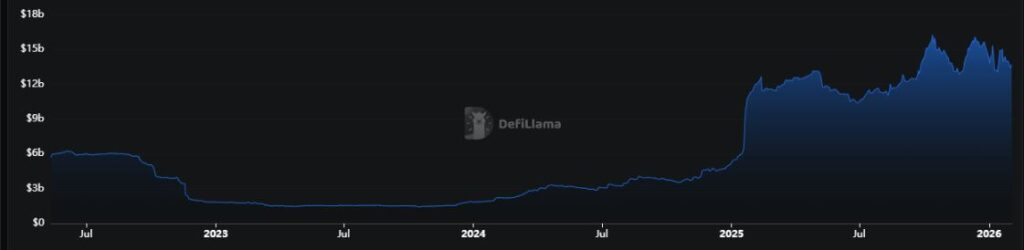
Together, these metrics show that Solana’s record activity is not solely explained by a higher number of transactions, but by intensive use of DeFi (decentralized finance) applications.
What happens to the price of solana?
This sharp increase in the use did not move to SOL pricewhich continues far from its historical levels.
At the time of publication of this note, SOL is trading around $103, which represents a near 65% drop from its all-time high (ATH) of $294, reached on January 18, 2025as reported by NoticiasVE.
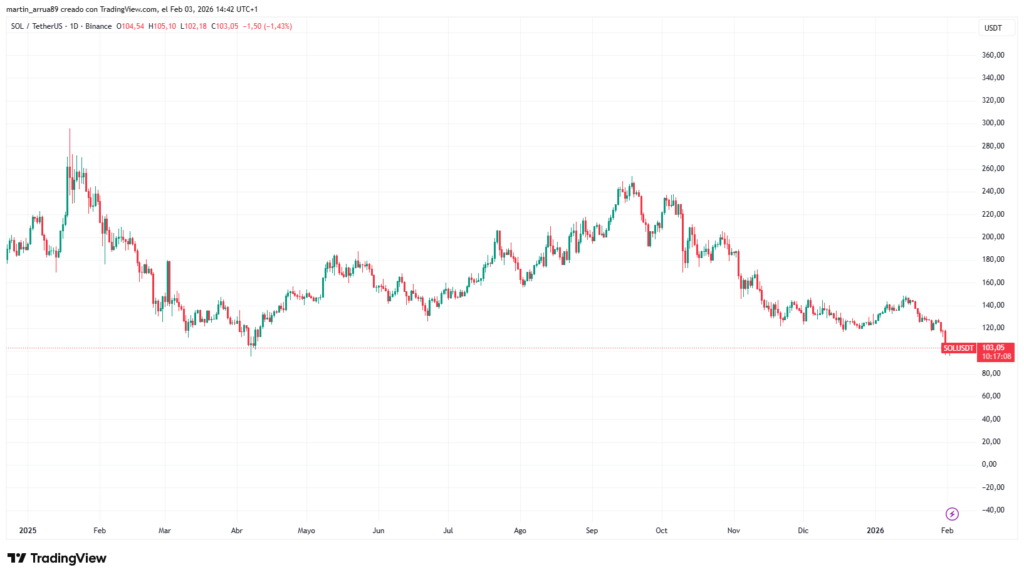
The contrast between record activity and a weakened price is once again on the table the disconnect between usage metrics and market performance.
One of the factors behind this dynamic is that the market usually prioritizes variables such as liquidity, short-term expectations and investor positioning, over operational data. Added to this is that A higher number of transactions does not necessarily imply an immediate increase in demand for SOL in the market.
The cost structure of the network also influences. If a transaction pays a commission in the order of 0.000005 SOL, at the current price that is approximately $0.000515 per transaction.
With such low commissions, the growth in transactional volume does not automatically translate in a “capture” of commissions that immediately modifies the balance of supply and demand for SOL.