
On the weekly chart, the IBEX 35 is trading around 17,850 points, which represents a slight correction of -0.15%, compared to last Friday’s close.
Despite this small setback, the weekly candle reflects increasing highs and lows compared to the previous candle, which also showed the same bullish dynamics. This confirms that positive inertia continues to predominate in the Ibex 35driven by demand. In fact, during this week a new annual and historical maximum was reached, located at 18,271 points. There are no significant spikes in volatility or downward breaks at the weekly high, indicating that the price continues to make new highs with no signs of a change in sentiment, even in the short term, defined as the next few sessions or weeks.
As long as the Ibex 35 does not close weekly candles below the medium-term bullish guideline, drawn from the April 2025 lows, the most probable hypothesis remains the continuation of the recording of new historical highsexceeding 18,271 points.
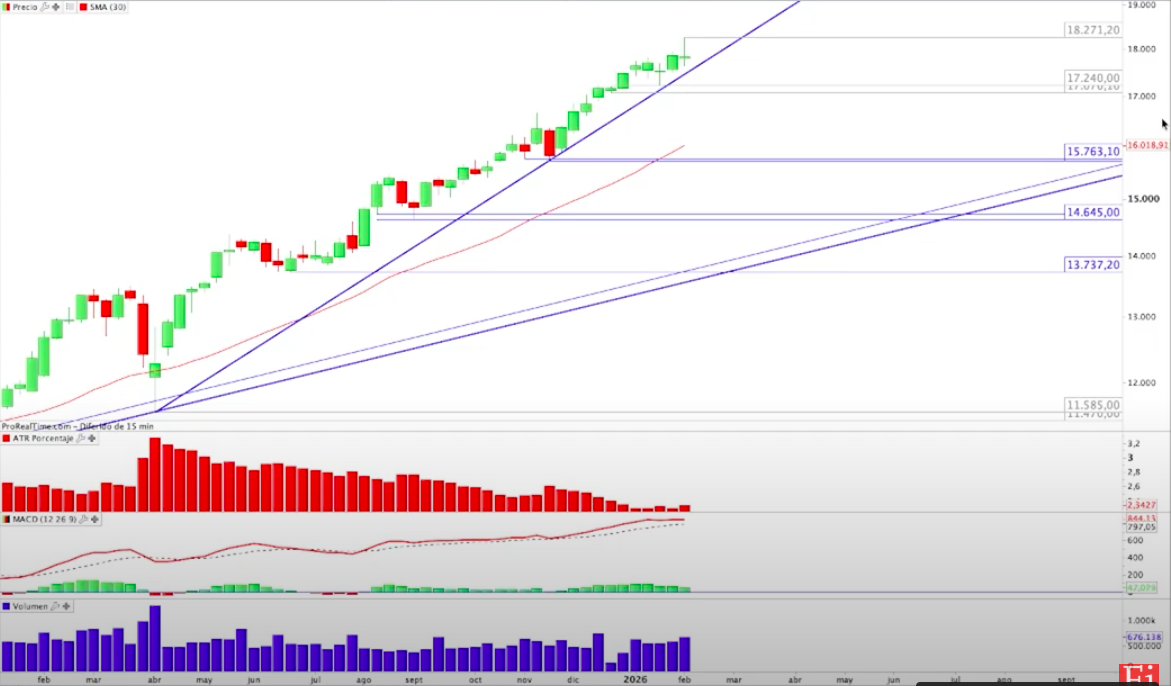
In conclusion, from a chartist and technical point of view, the Ibex maintains a solid bullish process, both in its secondary phase and in the long-term primary phase, with no developments that suggest a change in the current trend.