October is a very little dear month for investors. Seasonally it is thought that the falls or crashes of the indices occur in the tenth month of the year and there is some historical evidence that supports this fact: the Crash of 1929 and on black Monday of 1987 occurred in October although, to be fair, September is usually the bearish month and October only reflects the previous facts delayed.
Mark Twaiin’s uneuca “Pudd’nhead Wilson«It made clear that «October is one of the most dangerous months to speculate on shares. The others are July, January, September, April, November, March, June, December, August and February». The appointment is a sarcastic statement that speculation with actions is always dangerous. Twain wrote Pudd’nhead Wilson in 1894, many years before the falls of the 1929 stock market (commercial commercial volumes on October 24 and then on October 29), 1987 (the greatest losses on October 19) and 2008 (from October 6 to 10 was the worst weekly fall in history both in points and in percentage of the industrial average Dow Jones). On October 24, many of the world’s stock exchange experienced the worst falls in their history).
However, this month, Although he has had dramatic falls, he has also been key in the reversal of Baji marketsThis In fact, it has been a month of good performance for the S&P500 in the last 20 years. Also, for Nasdaq 100 and Dow Jones. Especially, once the first days have been overcome.
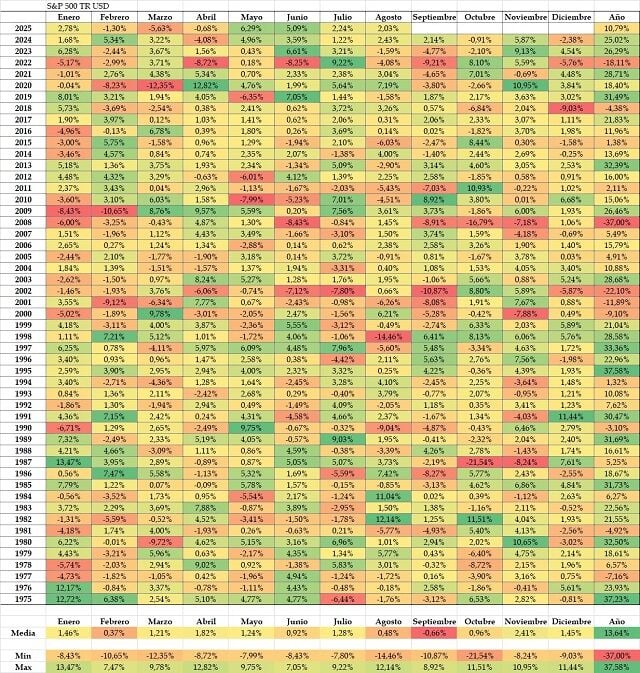
Source: Carlos Arenas Laorga
Beyond the estimated behavior in October, which can read below, the truth is that the average volatility of October is 33% higher than the average of the other 11 months.
The S&P 500 has risen 4.2% this September, aimed at its best September since 2013, and this quarter has risen 6.4%, keeping up in seven of the last eight quarters. Since 1950, there have been six previous cases in which the S&P 500 advanced between May and September, like this year. In that period, the index registered, on average, a loss of 0.6 % in October, but recorded a 3 % rise in the fourth quarter.
The three main American indices fell for the third consecutive day on Thursday, the first time this happens in almost half a year. “They did not even have a combined running streak so long in early April. Since that month of April, the S&P 500 has shot 33%, adding 15 billion dollars in market value and reaching 28 historical maximums in 2025. Yes, it has barely risen less than 1% since the type cut of the Federal Reserve of September 17, says Manuel Pinto, market strategist.
The flood of presentations of results will be part of a period of five weeks that will be crucial to know the final direction of the market. The hiring data that will be published on Friday will offer clues about the labor market, after the signals of weakness that promoted the first type cutting of the Fed in a year. Perhaps the most worrying thing is that the aggressive growth of benefits is already incorporated into actions prices.
The indices begin October at maximum or very close. What are the next levels?
The indices leave the month of October from historical maximums and with very demanding expectations: what happens in results and in the macro data will be decisive to know if October will be remembered as the beginning of correction or starting point of a year -end rally.
And, if the quarter of the quarter is taken into account, despite the bad reputation of October, the last three months of the year are statistically better for the Variable Income of the United States. From a technical point of view, Álvaro Nieto, technical analyst for investment strategies recognizes that «in the daily graph of El Index S&P 500, we find that, The price is very close to important levels of resistance in the surroundings of the 6,698.88 points, so that the price could give positions if we do not attend a clear break of this important resistancesince it is the second time that this level of roofs is reached. However, we will continue to maintain a positive vision for the index provided that we do not attend the drilling of the last minimum area that we place in the vicinity of the 6,551.15 points, since, the drilling of this level if it can open the door for a period of consolidation in the main US index. »

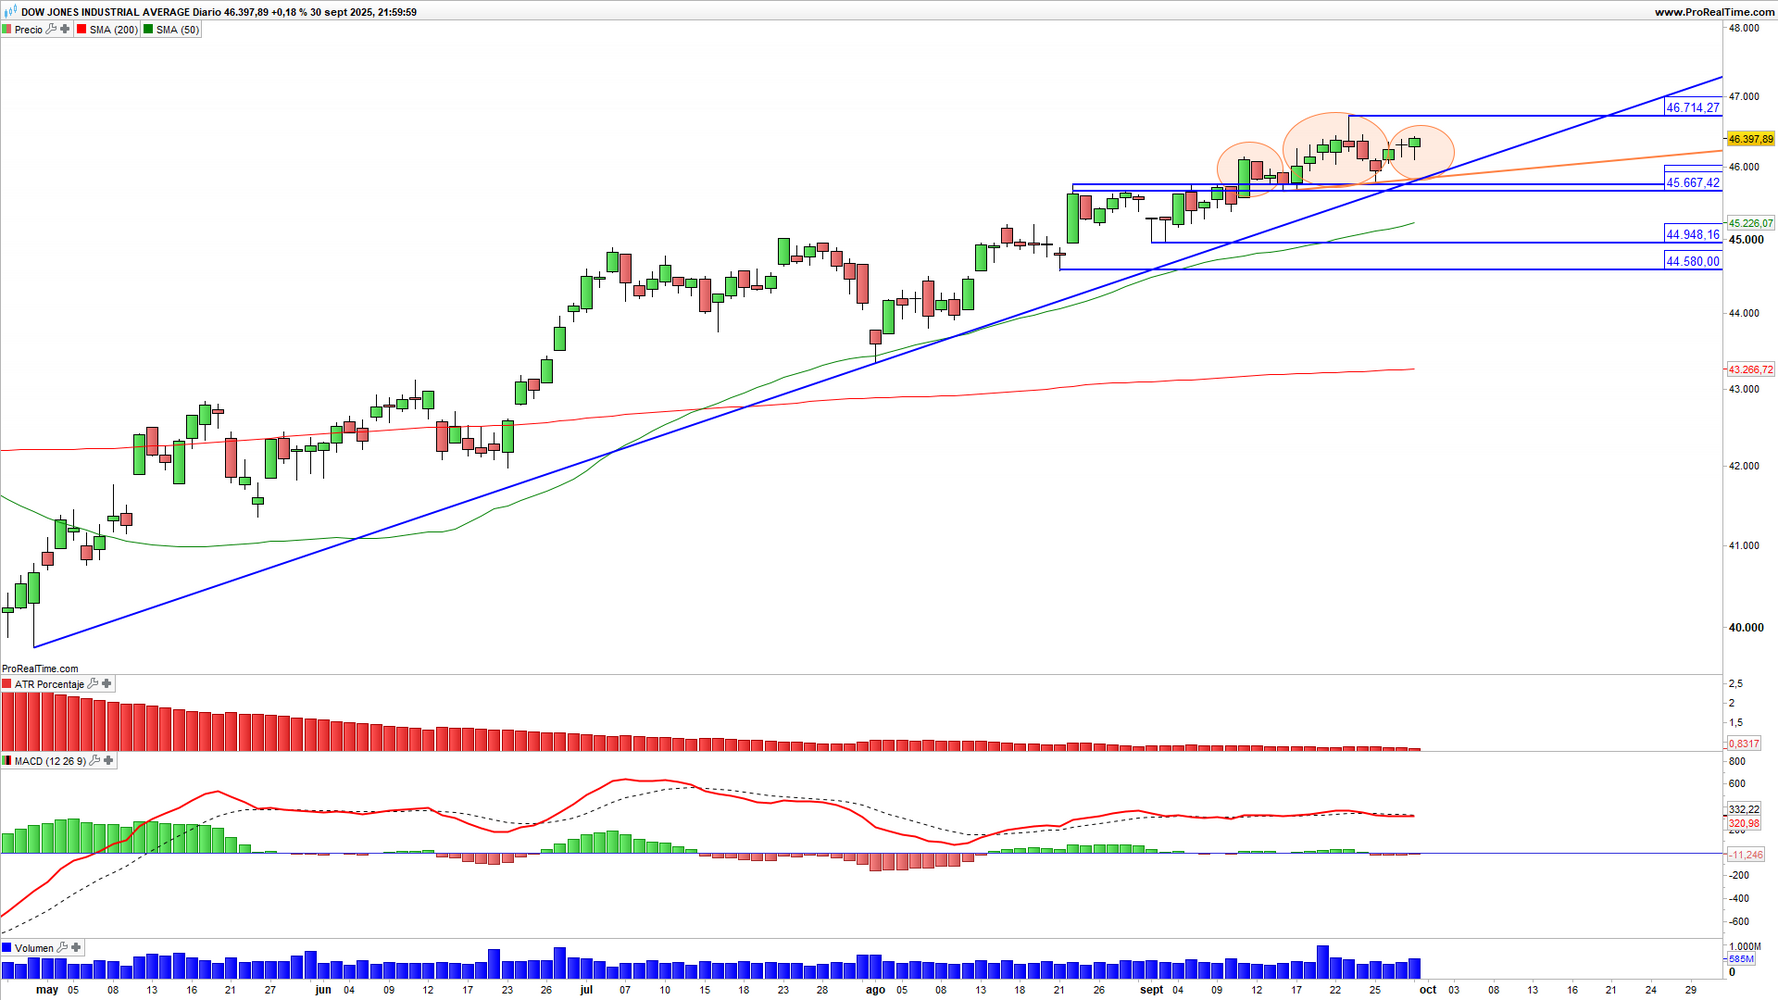
In the case of Dow Jones, the daily chart «may be developing a charrtist figure of distribution and bearish -shaped implications inverted shoulder, which could already have already completed the two shoulders and the head. In this sense, the bearish objective of the chartist in which the relevant minimum area is drilled in the surroundings of the 45,667.12 points, «says Nieto.
And in Europe? The indices have closed a more than positive month. The Eurostoxx 50 has risen 3.3%, with a revaluation close to 13% in the quarter, while the Dax ended practically flat the month despite the rise close to 20% in the last three months. In the case of IBEX 35, increases of 3.6% in September that opened up to 33.4% the increases in the quarter.
From a technical prism, «in the daily graph of the Dax40, we find the overcoming of Important resistance in the surroundings of 23,884 and 23,940 pointsso that the German market could continue to present a positive behavior in the next days, being the first support level to highlight the minimums of the session last Friday, September 26 at 23,579 points. Besides, The MACD oscillator does not have overcompra levels And, he approximates himself again above the border of level 0, «says the investment strategies.

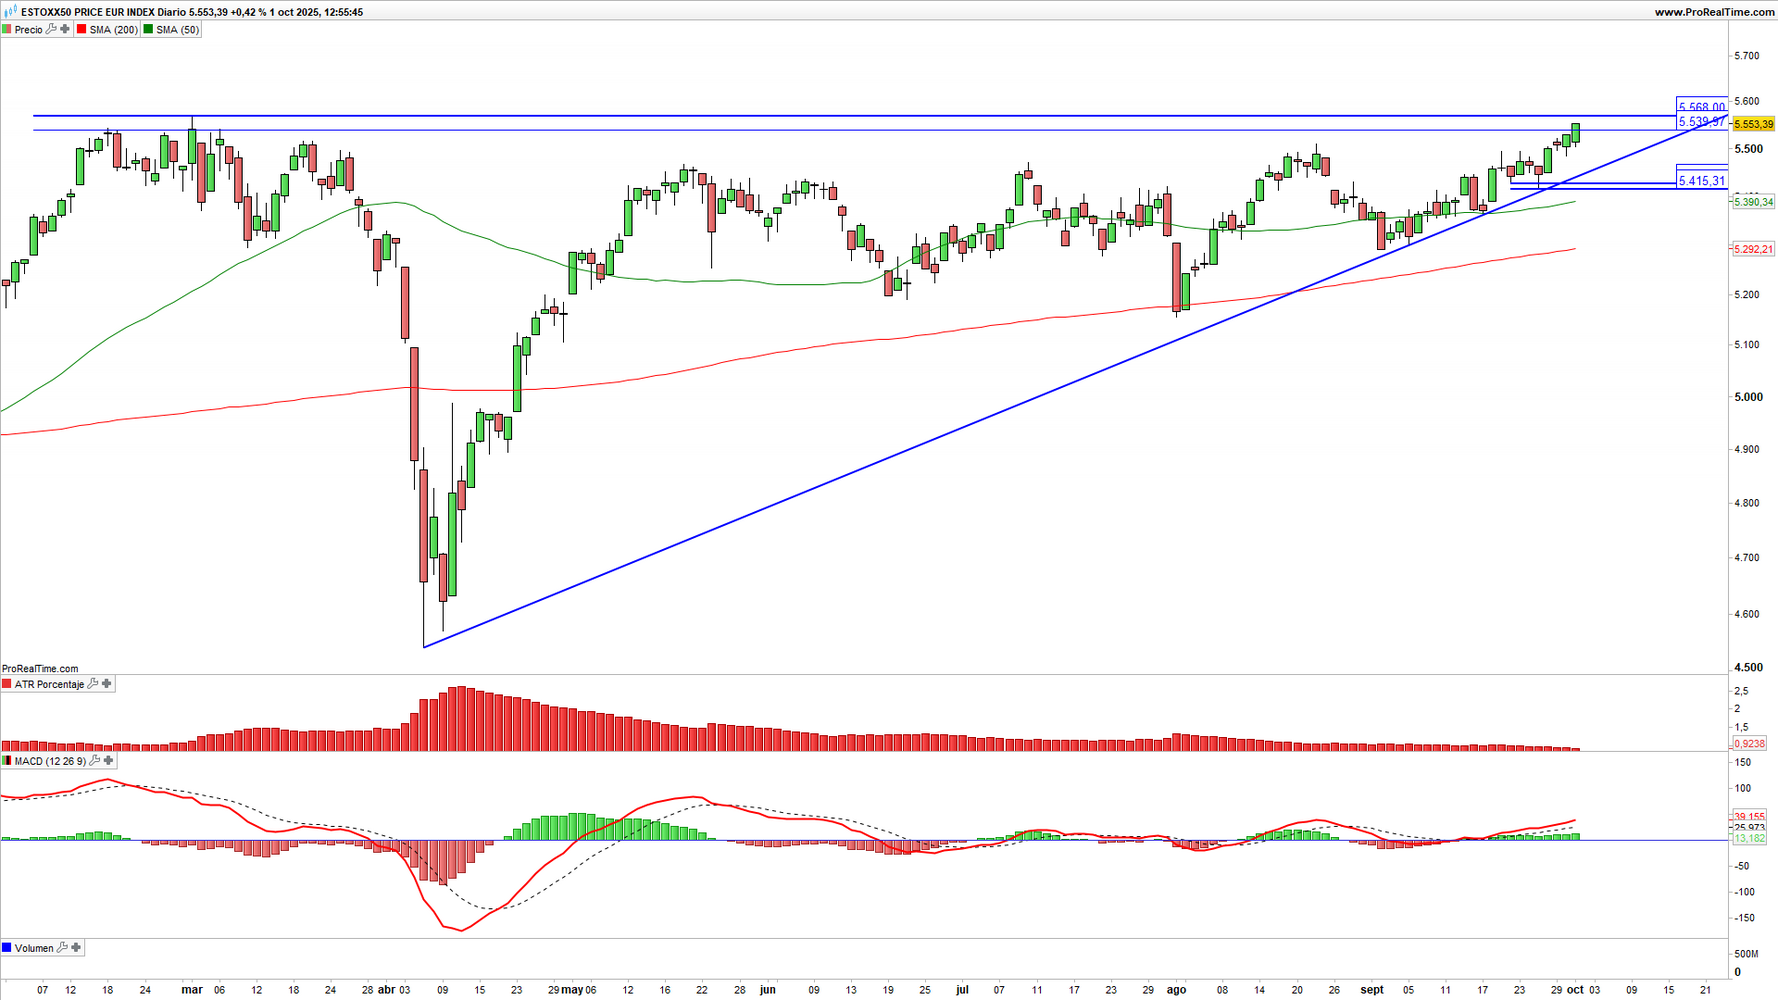
In the daily graph of the main European index, Eurostoxx50, «the price It is attacking important levels of resistance in the annual maximumslevels that we project from 5,539.97 and 5,568 points, so in case of not attending a daily closing price exceeding 5,568 points, we could attend a reaction by sales. However, we will keep the constructive attitude In the index provided that the price does not pierce the last area of increasing minimums in the vicinity of the 5,415.31 and 5,426.58 points, «says Nieto.
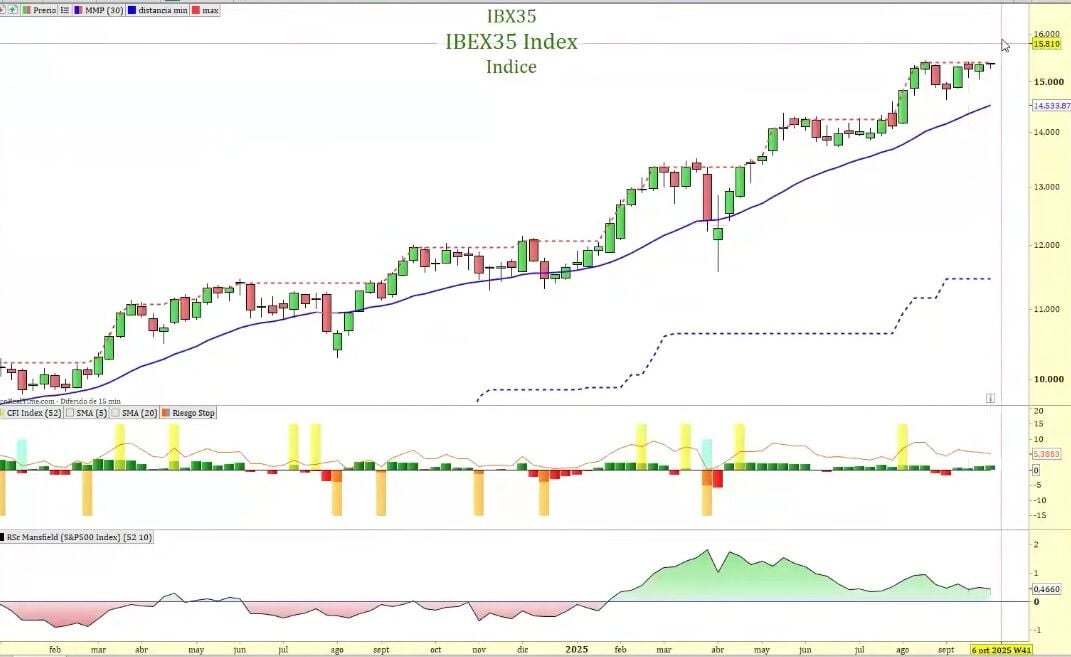
Finally, in the case of IBEX 35 «the upward trend is still valid. The level through which the 30-week average passes, and that tells us that it will continue to be bullish, are 14,533 points. While the price is maintained above, it is most likely that the selective continues to rise in a target in the 16,000-16.200 points by the end of the year. There is possible that there is some scare or correction but, if I had to choose an index in Europe. The IBEX 35, «says Javier Alfayate, from Grupo Link.