
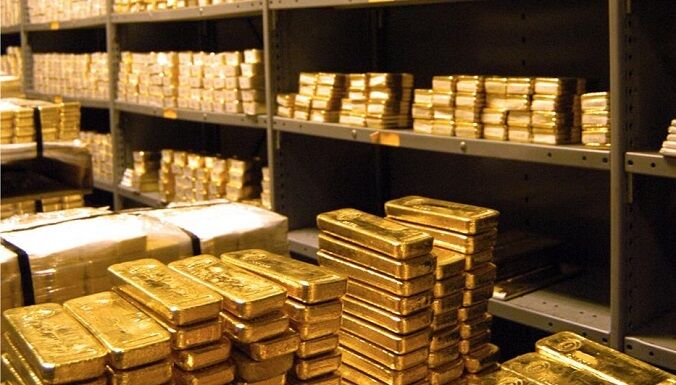
Evolution of gold as a financial asset
Throughout history, Gold has played an essential role in the financial system. Its function has evolved over time; in the first instance as the main currency of exchange in many civilizations, later as support for the fiat currency (gold standard) and, finally, as a financial asset.
Despite its constant evolution, far from losing value, it has continued to gain it. This asset, seen by many investors as a refuge and a protection mechanism against uncertainty and the depreciation of the fiat currency, has managed to gain a place in many portfolios, including those of central banks.
Illustration 1: Evolution of the gold price ($/oz)
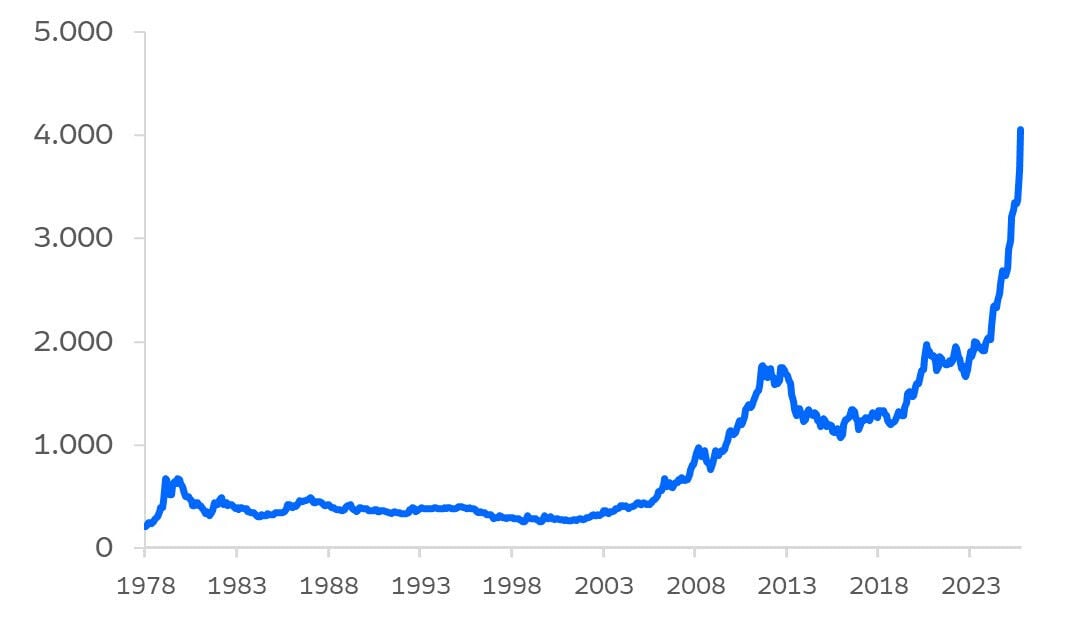
Source: World Gold Council, Ibercaja Gestión
The supply and demand of gold
Offer
According to estimates by the World Gold Council (WGC), approximately 209,000 tons of gold have been mined throughout history. Gold is not consumed or deteriorates like other raw materials. Therefore, all the gold mined over the years remains with us.
Now, where does the supply of gold come from? Essentially, from two main sources: (i) mining (~75%) and (ii) recycling (~25%). Gold production through mining is well diversified geographically, since no region produces more than 25% of the total global stock. This helps reduce risks of supply shocks and contributes to gold’s relatively low volatility.
During the previous two decades, Gold mining production has grown at a rate of around 2% annuallywhile the supply of recycled gold is more influenced by the price of gold and market sentiment.
The main characteristic of the supply of gold is the fact that it is highly inelastic and fixed in the short-medium term. That is, even if the price of gold rises a lot, production cannot increase quickly.
In this sense, the combination of a relatively liquid but small market and the general inelasticity of supply implies that gold is susceptible to large readjustments in prices from relatively small changes in demand, since Price is the “definitive arbiter” of gold.
Demand
Gold demand reached a historical record in 2024 with 4,974tn. Demand is mainly guided by 3 types of uses: (i) as a luxury good, (ii) as safe haven investment assets and (iii) as an industrial component. Much of the gold stock mined today is found in jewelry (45%), although its value as an investment asset has been gaining weight in the last 10 years.
Illustration 2: Distribution of all gold mined and in reserves
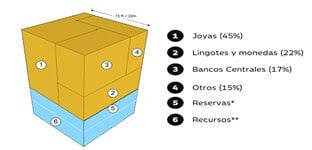
Source: World Gold Council, Ibercaja Management: Note: *Reserves correspond to gold found that is economically viable to extract. **Resources are volumes of gold about which less information is available and there is no economic plan for their extraction.
The demand for gold as an investment is particular, since its value does not depend on predetermined future cash flows – as in the case of fixed income – or expected – as in variable income. Its value derives from its ability to act as a safe haven asset in contexts of maximum geopolitical or inflationary uncertainty. Furthermore, it gains especially relevance in contexts of low or negative real interest rates, as it is an asset without implicit profitability.
In 2022, US sanctions on Russia led to a profound change in gold fundamentals. Central banks realized that holding much of their reserves in dollars was a risk. Given this, the flows of central banks towards this asset increased.
Illustration 3: Gold purchases from BCs and other public institutions in London OTC.Monthly data in tons
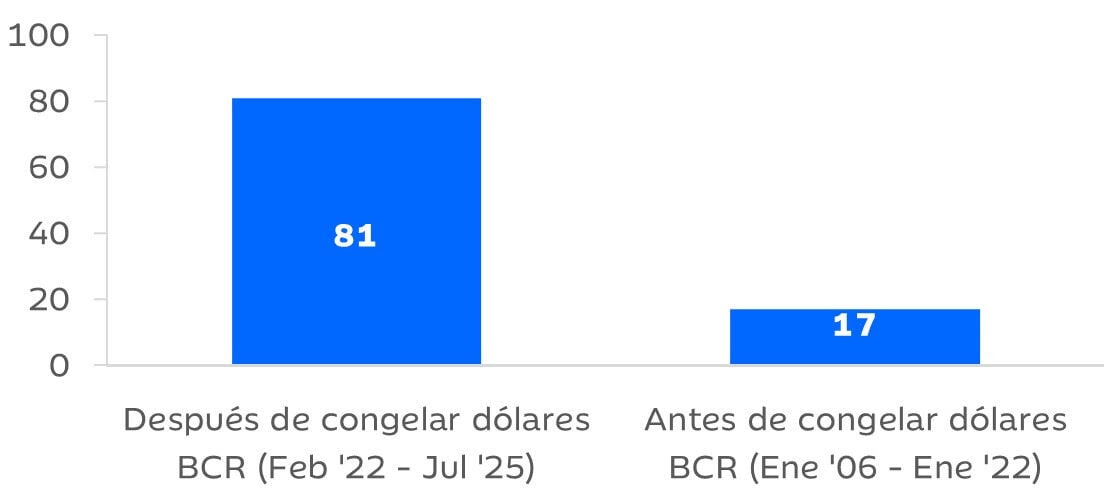
We have seen the last change in demand dynamics in 2025, where The retail investor and asset managers have emerged as buyers. ETFs are one of the ways through which investors channel their investment in gold. Gold ETFs experienced net outflows in 2024, but the dynamic has already reversed in 2025, where positive flows in the first quarter have offset the outflows in 2023 and 2024.
In conclusion, what is observed is a change in trend in the market dynamics that guide demand. For decades, real interest rates and the US bond curvedetermined the price of gold. Currently, this relationship seems broken, at least momentarily.
Let’s review the bullish cycles of gold
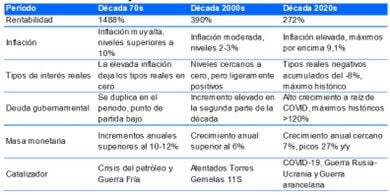
If we look back, we identify two clear periods where an extraordinary bullish cycle occurred in gold. The two largest bullish cycles present certain similarities with the current scenario. The two periods referred to are the 1970s and the 2000s, where gold suffered a revaluation of 1,488% and 390% respectively. The macro events that impacted the price of gold were inflation, real interest rates, growth in government debt levels, and increases in the money supply.
Illustration 4: Comparison of bullish gold markets
Fuente: Ibercaja Management
In the current scenario, we find multiple similarities that have not gone unnoticed by many investors and that have led to the current revaluation of gold. Geopolitical tension, high debt levels, growth via fiscal stimulus in Europe and growth thanks to AI productivity improvements are likely to lead us to a new inflationary normal, with inflation rates above 2%. If such a scenario ends up being established in the medium term, with negative real interest rates due to the complacency of central banks, gold can play a role as a transcendent asset, and gain weight in many portfolios compared to traditional fixed income.
The eternal comparison: gold vs mining companies
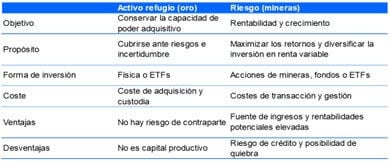
The question that every investor asks when deciding to buy gold is: What is better to buy gold or mining? Although the question is valid, it is necessary to know that we are dealing with two different types of investments and, therefore, they do not have to behave the same.
Illustration 5: Differences between investment in gold and mining
Fuente: Incrementum AG, Ibercaja Gestión.
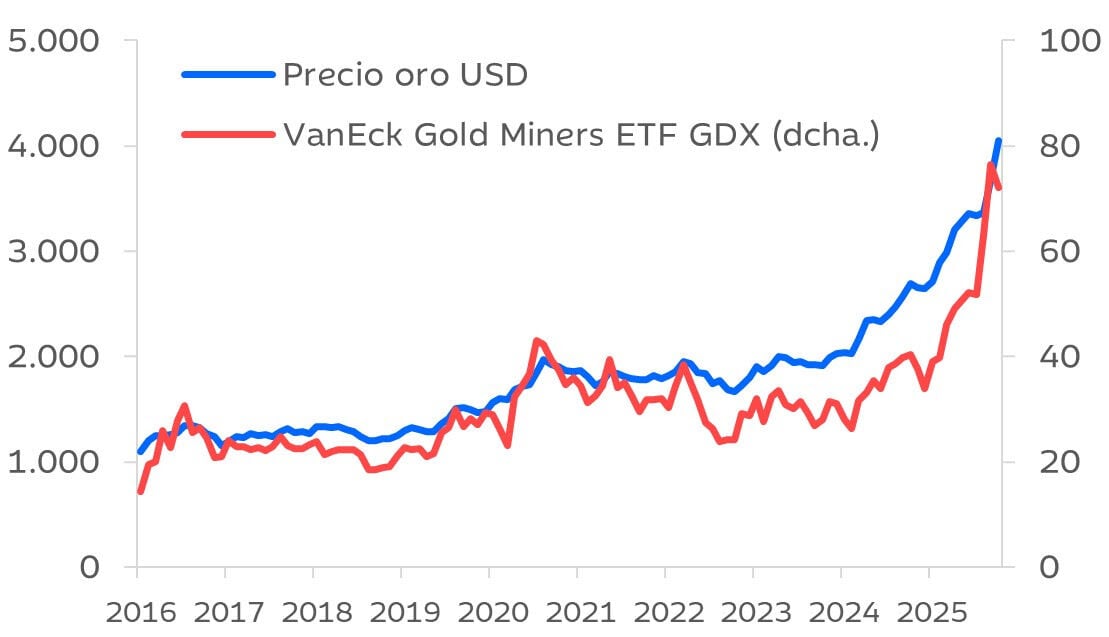
In general, gold has performed better than the main mining index (GDX) in the last 10 years, but at the beginning of 2025 the profitability gap has closed. So far this year, the mining index has obtained a return of 133% (vs. 60% gold).
Illustration 6: Gold price vs mining ETFs
Fuente: Bloomberg, Ibercaja Gestión
Although the price of gold guides the behavior of mining companies in many cases, investment in the latter faces multiple other risks, from operational to the usual company management or balance sheet risks.
The reasons why the returns of mining companies have doubled those of gold are mainly three: (i) The mining index had been accumulating a negative profitability gap of close to 30% against gold since the beginning of 2023. (ii) The index has seen considerable multiple expansion over the past 12 months, going from 10.9x TTM P/E to 33.2 TTM P/E. (iii) The current price of gold is such that more than 95% of known gold production is profitable, therefore, the AISC can barely increase in the short term and the thesis that investment in mining companies is a leveraged investment in gold is fulfilled for the vast majority of the companies that make up the index.
When considering investing in gold miners, it is key to carry out a bottom-up analysis and choose with surgical precision in which companies the investment is made. Multiple studies point to the great added value that active management provides in the investment of gold miners.
In conclusion, The investor must analyze his or her particular situation and decide what type of investment best suits his or her savings needs.. In the case of positioning in gold, the expected returns are high and the volatility of the asset will potentially be lower. In the case of deciding to invest in gold miners, the evidence shows that active management creates value and stock picking of shares allows generating a much higher profitability than mere indexation.
Why have miners beaten the S&P 500 and Gold in 2025?
With just weeks to go until the end of the year, the S&P 500 continues to trade at all-time high levels and is on track to record a return of ~15%. The GDX mining index accumulates a profitability of 133% YTD in 2025. That is, Anyone who has invested in gold and not in mining will be happy (+60% YTD), but they have lost part of the pie.
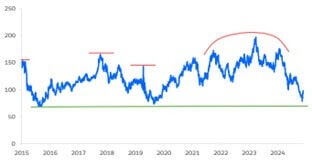
With this spectacular revaluation, it is worth wondering if there is still room to see more increases or if the train has already been lost and it is better to look elsewhere – or towards gold. Looking at the S&P500/GDX ratio it is possible to see that after years of dominance of the S&P 500 over mining companies, The trend has reversed towards the minimum levels of 2015 and 2019.
Illustration 8: Evolución ratio S&P 500 vs GDX
Fuente: Incrementum AG, Ibercaja Gestión.
If we also look at the evolution of the peaks indicated in the graph, with the last one forming between 2023 and 2025, we see how the trend suggested a change towards a better relative performance of the miners compared to the S&P 500; just what has happened during 2025.
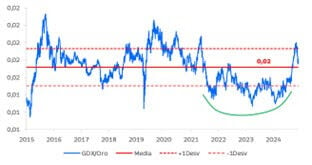
In bull markets, gold mining stocks tend to trade at a premium to the price of gold (ie 2020). Along these lines, the GDX/Gold ratio indicates that, over the past few years, gold miners have been trading more than one standard deviation below the mean.
Therefore, the main answer to the title of this section is that Gold miners were very undervalued in relative terms compared to gold and it was a matter of time before this valuation gap was reversed. Added to this, the gold rally during 2025 has created the perfect storm to accelerate the closing of that gap.
Illustration 9: GDX vs Gold ratio evolution
Fuente: Bloomberg, Ibercaja Gestión.
In short, andhe gold mining sector continues to struggle with its poor reputation for financial discipline, a perception rooted in the 2010s, but we believe this reputation is no longer justified. Among senior management teams in particular, there is now a strong focus on conservative financial practices and it appears the sector has learned from past mistakes.