

He founder of Berkshire HathawayWarren Buffettis one of the great investors followed by the investing universe given his extensive and winning career. The Omaha Circle carries selling shares of his portfolio since the beginning of the bull market of the S&P 500 in the fourth quarter 2022. Ascending them to 184 billion dollarsleaving a Record $381 billion in cash and short-term investments in it third quarter of 2025. This leaves a warning message for investors on the current valuation of the index in the face of a high CAPE, according to Trevor Jennewine and Yahoo Finance.
Investors should ask themselves why. One explanation is that Berkshire is already so big that very few stocks could influence the company’s financial situation, and perhaps those that do could be too expensive or outside of Buffett’s purview. On the other hand, Buffett could simply be worried about the valuation of the entire stock market.
He S&P 500 quotes at one historically expensive valuation that portends a sharp fall in the coming years.
In November, the S&P 500 had a Cyclically adjusted price-earnings (CAPE) ratio of 40one of the highest valuations in history. While traditional price-earnings (P/E) ratios are calculated using the prior year’s earnings, CAPE ratios are based on inflation-adjusted average earnings over the past decade.
He economist Robert Shiller developed the CAPE ratio as a more accurate way to value stock indices such as the S&P 500. By averaging inflation-adjusted earnings over a 10-year period, the CAPE ratio offers a better perspective than the traditional price-to-earnings ratio by smoothing out the volatility that naturally occurs throughout the business cycle.
As mentioned, the S&P 500 had an average CAPE ratio of 40 in November. The index has only registered a Monthly CAPE ratio of at least 40 on 22 occasions since its inception in 1957. In other words, the US stock market has been less than 3% expensive over the past seven decades.
Unfortunately, the S&P 500 has generally delivered dismal future returns from such a lofty valuation. The chart below shows the best, worst, and average returns of the S&P 500 over different time periods following a monthly CAPE of 40 or higher.
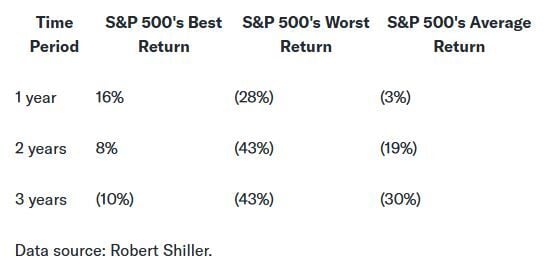
The graph above contains two particularly important pieces of information. First, after recording a monthly CAPE of at least 40, the S&P 500 has never generated a positive return in the following three years. Instead, the index has fallen between 10% and 43%.
Secondly, after registering a monthly CAPE of at least 40, the average profitability del S&P 500 in the silo negative in the next one, two and three years. In fact, the three-year average implies that the index will fall by 30% by December 2028.
Why the S&P 500’s high CAPE may be less worrying than it first appears?
CAPE has one important limitation: it is calculated based on retrospective data, but what really matters to the market is how quickly earnings grow in the future.
He S&P 500 net profit margin expanded 4.4 percentage points in the last decade due to lower corporate tax rates and technological innovation. This trend is likely to persist in the coming years as more companies adopt AI tools.
As a result, investors may have a greater tolerance for high valuations today than in the past. If earnings growth accelerates in the future, the S&P 500’s CAPE ratio could moderate without a substantial decline in the index.
That said, it’s undeniable that the S&P 500 is expensive by historical standards, and that will likely lead to volatile trading conditions even in the best of times. Investors should be cautious. Now is not the time to chase momentum stocks at absurd valuations. Instead, investors should be selective (like Warren Buffett) with the stocks they add to their portfolios and should sell any stocks they are not comfortable holding during a downturn.
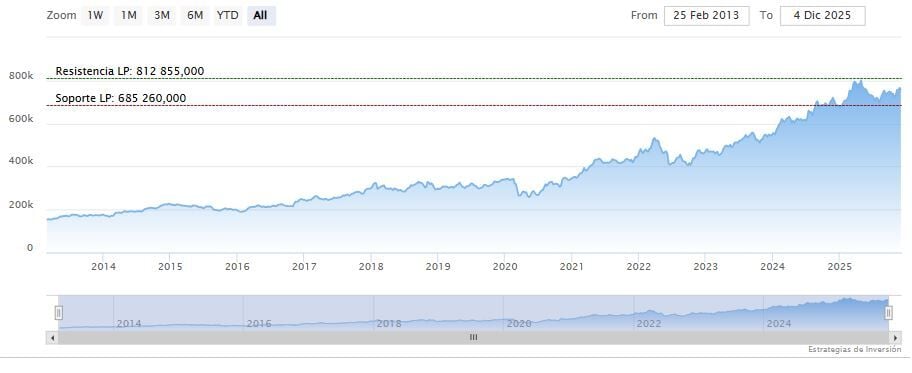
Berkshire HathawayIt was trading lower on Friday afternoon at $753,434. The 200 period moving average is below the last nineteen candles, RSI is down at 51 points and the MACD lines are above the zero level.
Medium-term resistance is at $775,000. Meanwhile, Ei indicators are mixed.