
The bags quoted in the stock market (ETF), the cryptocurrency of the Ethereum Network, face a negative streak on Wall Street, accumulating six consecutive days of capital exits.
Yesterday, September 9, Financial instruments registered a net exit of 96.69 million dollarsled by the Ishares Ethereum Trust ETF (ETHA) of Blackrock, which lost 192 million dollars.
In contrast, other funds such as the Grayscale Ethereum Trust (ETHE), Fidelity Ethereum Fund (Feth) and the Groyscale Ethereum Mini Trust (ETH) reported tickets of 9.5 million, 75.5 million and 11.3 million dollars, respectively, according to Slo Value data.
During these six days, the total outputs of the ETS ETF of ETH total 952 million dollarsreflecting significant pressure on these financial products.
The following graphic, provided by Soso Value, shows how capital flow has been from and to the ETHher ETF since its launch:
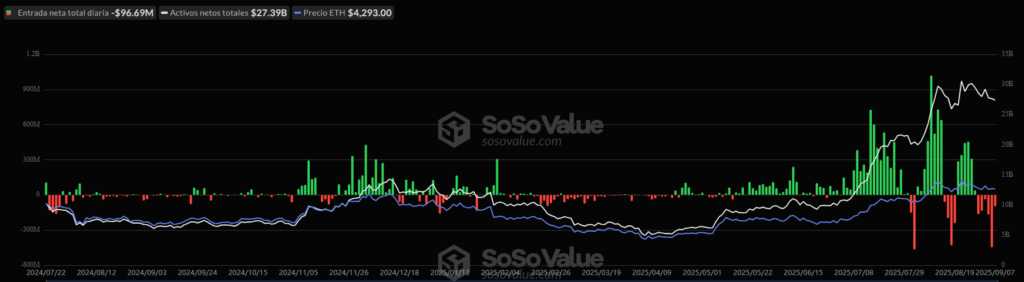
Despite this scenario, the price of ETH remains stable around 4,300 dollars, showing resilience against capital exit. This stability suggests a strong ETH buying pressure in the direct market, outside the ETFs.
This is a sign that investors could be positioning facing September 17, when Jerome Powell, president of the United States Federal Reserve (Fed), will announce a possible cut of interest rates, as presented cryptootics. A cut would facilitate access to loans, injecting liquidity that could benefit assets such as cryptocurrencies, including ETH and Bitcoin (BTC).
On the other hand, the performance of the ETF directly influences the eth -price, since the managers of these funds must acquire and maintain the cryptocurrency to support their actions. A greater demand for ETF promotes the purchase of ETH, which, by the law of supply and demand, tends to raise its price. However, current outputs reflect a lower capital entry in these instruments, which limits the bullish impulse.
In technical terms, ETH is in a critical area. The key levels are in 4,200 dollars, which acts as a support, and $ 4,500, which could trigger an upward movement if it is exceeded.
According to an analysis of the specialist Jainam Mehta, the parabolic SAR, an indicator that measures the direction and strength of the trend, remains above the price, indicating selling pressure. In addition, the Relative Force Index (RSI), which evaluates the impulse of the market, is 49, indicating a balance between buyers and vendors.
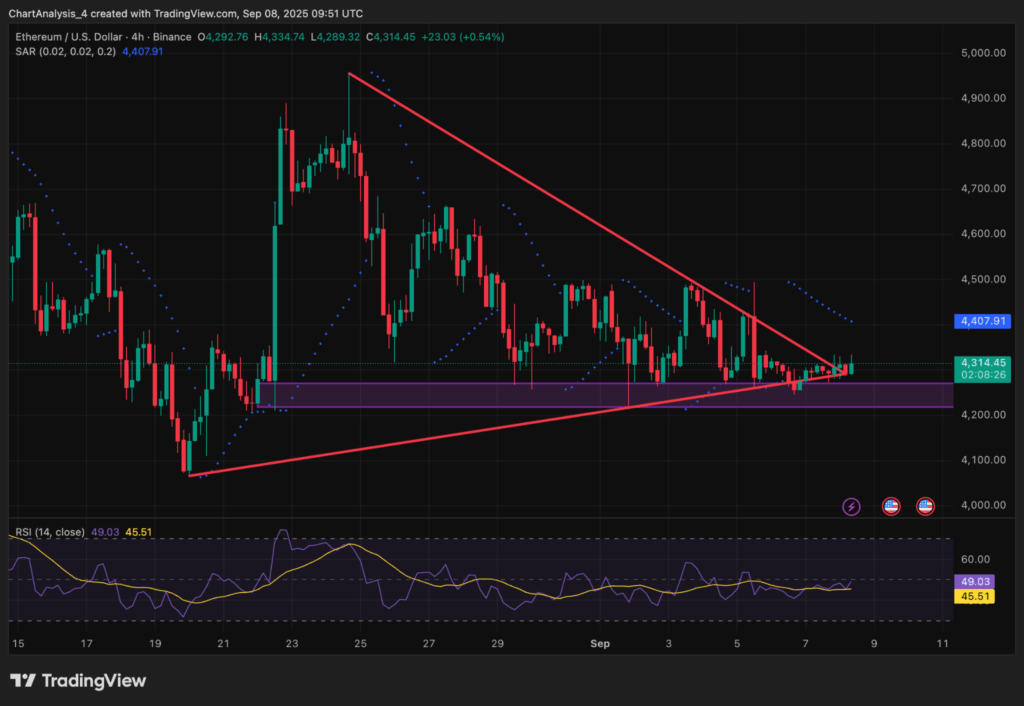
Mehta Describe the situation as a «wait and see» phasewhere rebounds lose strength quickly, but setbacks find purchase support.
If ETH manages to exceed the range of 4,450-4,500 dollars, It could be aimed at $ 4,800, entering clearly bullish landhe says. On the contrary, a fall below 4,200 dollars could take the price to the range of 3,800-3,900 dollars, a level that has historically served as a basis for recoveries.