
The weekly chart of the IBEX 35, which allows us to see with greater clarity and context the impact of the last weekly candle, shows that the Ibex 35 falls around 1.2% compared to the previous week. A fall that «starts from an area of maximums close to 18,270 points, where during this week a maximum of 18,267 was marked. It is evident that those historical maximums from last year continue to function as a short-term resistance barrier,» says González.
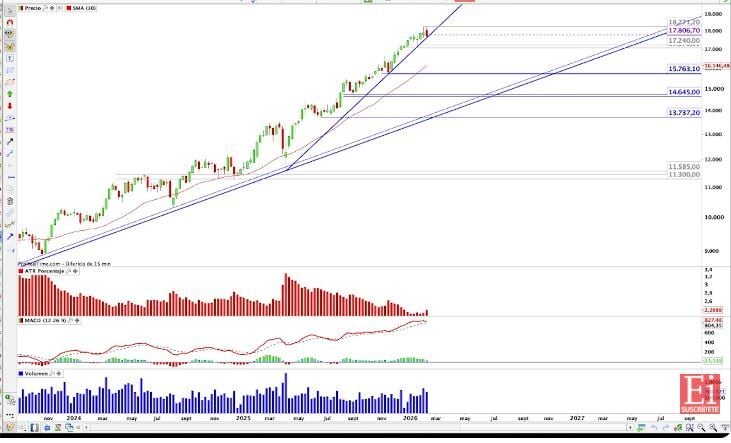
Despite the falls, this week has not been of special impact in terms of sales, «although we must be attentive to a possible closing below 17,806 points, which would be the minimum opening level of the previous candle. If the closing ends below that figure, we would be facing a bearish engulfing candle, which would increase the probabilities that, in the coming weeks, we could see a correction towards the medium-term secondary growing guidelineoriginating from the April 2025 lows. This scenario is something we should not overlook.»
It is important to highlight that This does not imply the beginning of a significant market correction. «We will continue to monitor developments on a weekly basis. However, a bearish engulfing candle in an area of all-time highs, combined with a context of extreme overbought according to the weekly MACD, invites prudence and caution, especially in the short term.»
See the complete analysis of all the values that make up the Ibex 35